
Mapa mental
Quality
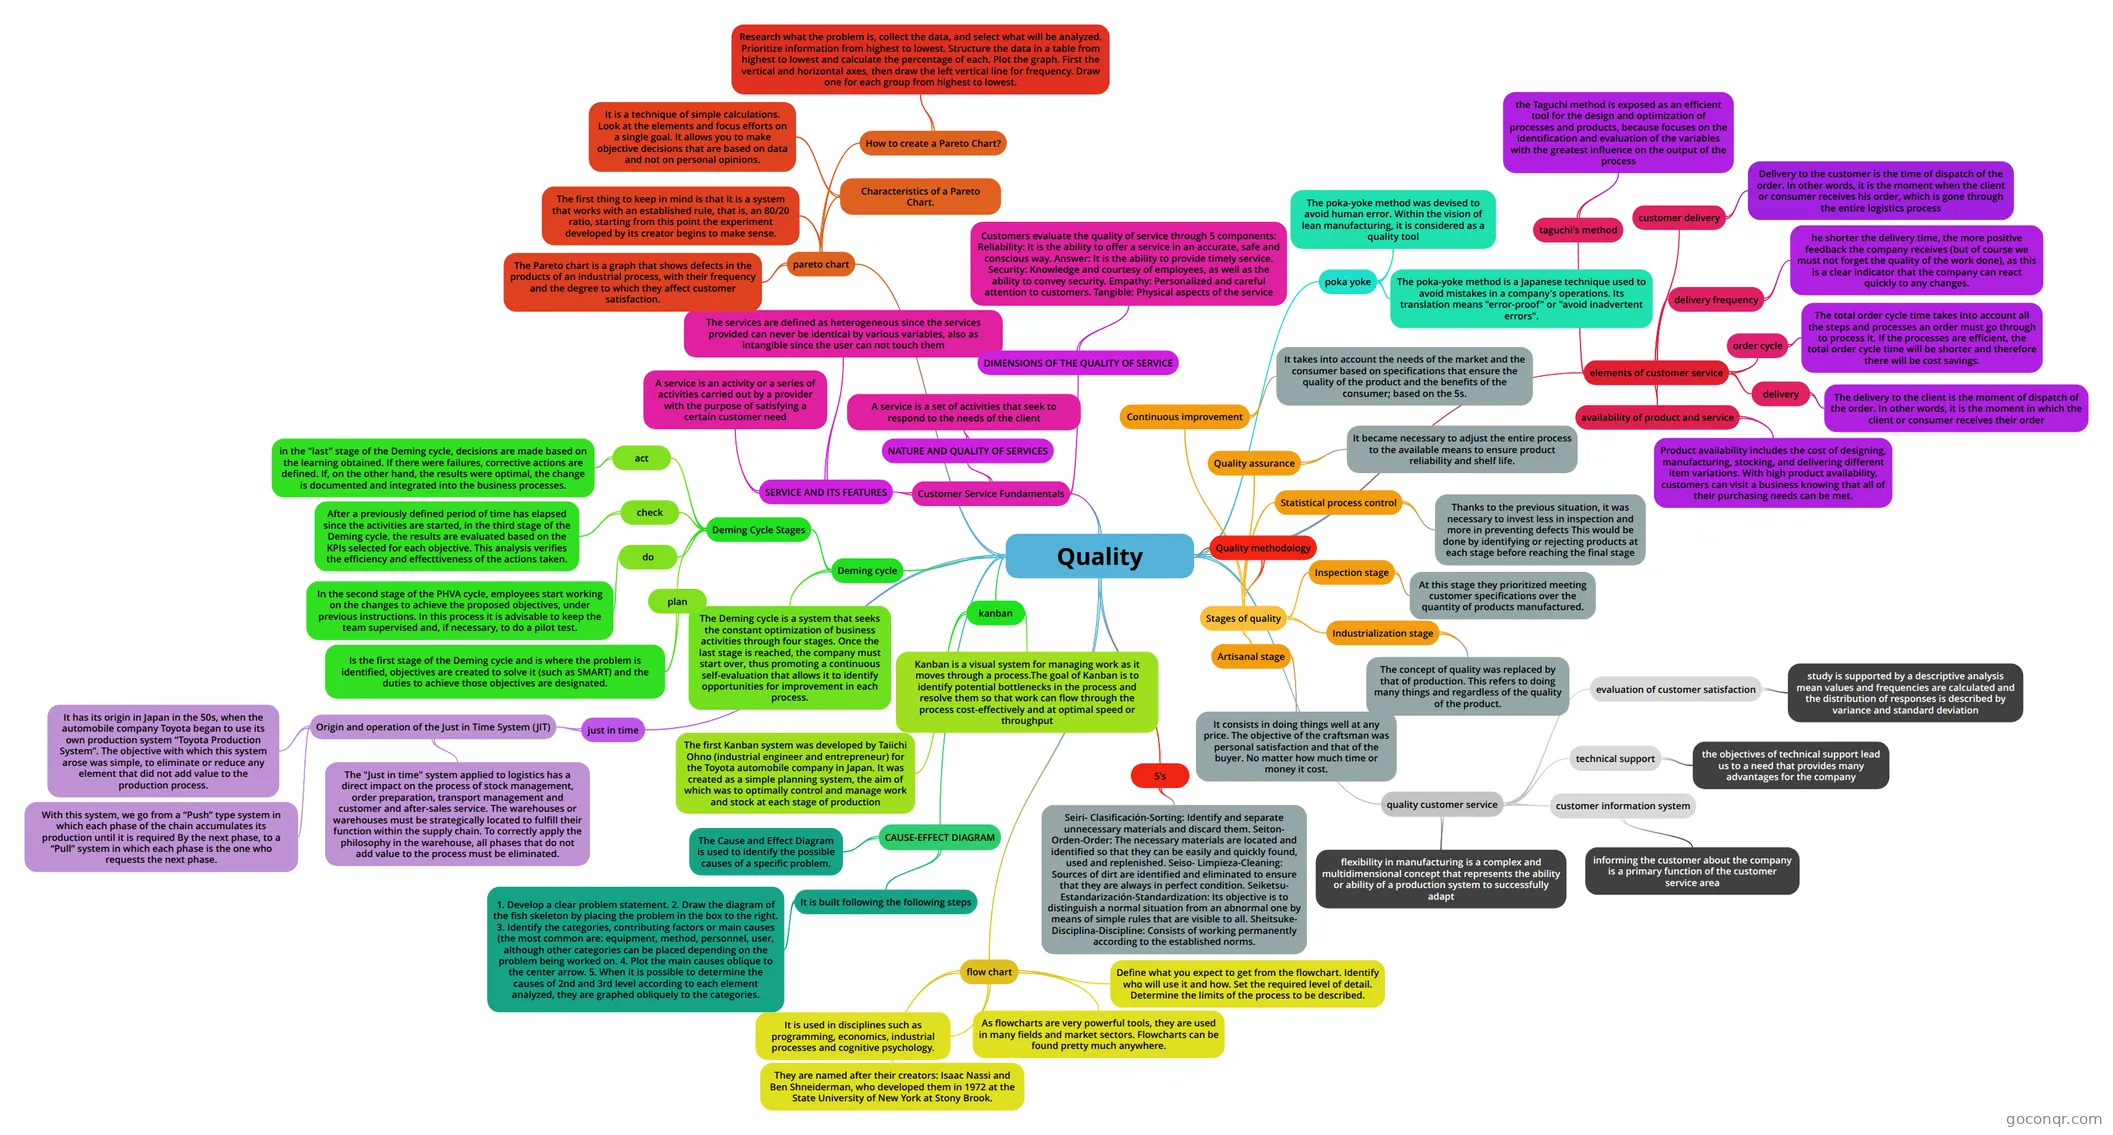
Mind map: quality tools and customer service
Contenido del mapa
Quality
CAUSE-EFFECT DIAGRAM
- The Cause and Effect Diagram is used to identify the possible causes of a specific problem.
- It is built following the following steps
- 1. Develop a clear problem statement. 2. Draw the diagram of the fish skeleton by placing the problem in the box to the right. 3. Identify the categories, contributing factors or main causes (the most common are: equipment, method, personnel, user, although other categories can be placed depending on the problem being worked on. 4. Plot the main causes oblique to the center arrow. 5. When it is possible to determine the causes of 2nd and 3rd level according to each element analyzed, they are graphed obliquely to the categories.
Deming cycle
- The Deming cycle is a system that seeks the constant optimization of business activities through four stages. Once the last stage is reached, the company must start over, thus promoting a continuous self-evaluation that allows it to identify opportunities for improvement in each process.
- Deming Cycle Stages
- plan
- Is the first stage of the Deming cycle and is where the problem is identified, objectives are created to solve it (such as SMART) and the duties to achieve those objectives are designated.
- do
- In the second stage of the PHVA cycle, employees start working on the changes to achieve the proposed objectives, under previous instructions. In this process it is advisable to keep the team supervised and, if necessary, to do a pilot test.
- check
- After a previously defined period of time has elapsed since the activities are started, in the third stage of the Deming cycle, the results are evaluated based on the KPIs selected for each objective. This analysis verifies the efficiency and effecttiveness of the actions taken.
- act
- in the "last" stage of the Deming cycle, decisions are made based on the learning obtained. If there were failures, corrective actions are defined. If, on the other hand, the results were optimal, the change is documented and integrated into the business processes.
- plan
kanban
- Kanban is a visual system for managing work as it moves through a process.The goal of Kanban is to identify potential bottlenecks in the process and resolve them so that work can flow through the process cost-effectively and at optimal speed or throughput
- The first Kanban system was developed by Taiichi Ohno (industrial engineer and entrepreneur) for the Toyota automobile company in Japan. It was created as a simple planning system, the aim of which was to optimally control and manage work and stock at each stage of production
Quality methodology
- Stages of quality
- Artisanal stage
- It consists in doing things well at any price. The objective of the craftsman was personal satisfaction and that of the buyer. No matter how much time or money it cost.
- Industrialization stage
- The concept of quality was replaced by that of production. This refers to doing many things and regardless of the quality of the product.
- Inspection stage
- At this stage they prioritized meeting customer specifications over the quantity of products manufactured.
- Statistical process control
- Thanks to the previous situation, it was necessary to invest less in inspection and more in preventing defects This would be done by identifying or rejecting products at each stage before reaching the final stage
- Quality assurance
- It became necessary to adjust the entire process to the available means to ensure product reliability and shelf life.
- Continuous improvement
- It takes into account the needs of the market and the consumer based on specifications that ensure the quality of the product and the benefits of the consumer; based on the 5s.
- Artisanal stage
- Stages of quality
5's
- Seiri- Clasificación-Sorting: Identify and separate unnecessary materials and discard them. Seiton- Orden-Order: The necessary materials are located and identified so that they can be easily and quickly found, used and replenished. Seiso- Limpieza-Cleaning: Sources of dirt are identified and eliminated to ensure that they are always in perfect condition. Seiketsu- Estandarización-Standardization: Its objective is to distinguish a normal situation from an abnormal one by means of simple rules that are visible to all. Sheitsuke- Disciplina-Discipline: Consists of working permanently according to the established norms.
Customer Service Fundamentals
- NATURE AND QUALITY OF SERVICES
- A service is a set of activities that seek to respond to the needs of the client
- SERVICE AND ITS FEATURES
- A service is an activity or a series of activities carried out by a provider with the purpose of satisfying a certain customer need
- The services are defined as heterogeneous since the services provided can never be identical by various variables, also as intangible since the user can not touch them
- DIMENSIONS OF THE QUALITY OF SERVICE
- Customers evaluate the quality of service through 5 components: Reliability: It is the ability to offer a service in an accurate, safe and conscious way. Answer: It is the ability to provide timely service. Security: Knowledge and courtesy of employees, as well as the ability to convey security. Empathy: Personalized and careful attention to customers. Tangible: Physical aspects of the service
- NATURE AND QUALITY OF SERVICES
poka yoke
- The poka-yoke method is a Japanese technique used to avoid mistakes in a company's operations. Its translation means "error-proof" or "avoid inadvertent errors".
- The poka-yoke method was devised to avoid human error. Within the vision of lean manufacturing, it is considered as a quality tool
quality customer service
- flexibility in manufacturing is a complex and multidimensional concept that represents the ability or ability of a production system to successfully adapt
- customer information system
- informing the customer about the company is a primary function of the customer service area
- technical support
- the objectives of technical support lead us to a need that provides many advantages for the company
- evaluation of customer satisfaction
- study is supported by a descriptive analysis mean values and frequencies are calculated and the distribution of responses is described by variance and standard deviation
flow chart
- It is used in disciplines such as programming, economics, industrial processes and cognitive psychology.
- They are named after their creators: Isaac Nassi and Ben Shneiderman, who developed them in 1972 at the State University of New York at Stony Brook.
- As flowcharts are very powerful tools, they are used in many fields and market sectors. Flowcharts can be found pretty much anywhere.
- Define what you expect to get from the flowchart. Identify who will use it and how. Set the required level of detail. Determine the limits of the process to be described.
just in time
- Origin and operation of the Just in Time System (JIT)
- It has its origin in Japan in the 50s, when the automobile company Toyota began to use its own production system “Toyota Production System”. The objective with which this system arose was simple, to eliminate or reduce any element that did not add value to the production process.
- With this system, we go from a “Push” type system in which each phase of the chain accumulates its production until it is required By the next phase, to a “Pull” system in which each phase is the one who requests the next phase.
- The "Just in time" system applied to logistics has a direct impact on the process of stock management, order preparation, transport management and customer and after-sales service. The warehouses or warehouses must be strategically located to fulfill their function within the supply chain. To correctly apply the philosophy in the warehouse, all phases that do not add value to the process must be eliminated.
- Origin and operation of the Just in Time System (JIT)
pareto chart
- The Pareto chart is a graph that shows defects in the products of an industrial process, with their frequency and the degree to which they affect customer satisfaction.
- The first thing to keep in mind is that it is a system that works with an established rule, that is, an 80/20 ratio, starting from this point the experiment developed by its creator begins to make sense.
- Characteristics of a Pareto Chart.
- It is a technique of simple calculations. Look at the elements and focus efforts on a single goal. It allows you to make objective decisions that are based on data and not on personal opinions.
- How to create a Pareto Chart?
- Research what the problem is, collect the data, and select what will be analyzed. Prioritize information from highest to lowest. Structure the data in a table from highest to lowest and calculate the percentage of each. Plot the graph. First the vertical and horizontal axes, then draw the left vertical line for frequency. Draw one for each group from highest to lowest.
elements of customer service
- availability of product and service
- Product availability includes the cost of designing, manufacturing, stocking, and delivering different item variations. With high product availability, customers can visit a business knowing that all of their purchasing needs can be met.
- delivery
- The delivery to the client is the moment of dispatch of the order. In other words, it is the moment in which the client or consumer receives their order
- order cycle
- The total order cycle time takes into account all the steps and processes an order must go through to process it. If the processes are efficient, the total order cycle time will be shorter and therefore there will be cost savings.
- delivery frequency
- he shorter the delivery time, the more positive feedback the company receives (but of course we must not forget the quality of the work done), as this is a clear indicator that the company can react quickly to any changes.
- customer delivery
- Delivery to the customer is the time of dispatch of the order. In other words, it is the moment when the client or consumer receives his order, which is gone through the entire logistics process
- taguchi's method
- the Taguchi method is exposed as an efficient tool for the design and optimization of processes and products, because focuses on the identification and evaluation of the variables with the greatest influence on the output of the process
- availability of product and service
Información
- Descripción
- Mapa Mental sobre Quality, creado por Rene Vazquez el 17/11/2022.
- Creado por
- Rene Vazquez
- Visitas
- 2
- Valoración