
Mapa mental
Statistics

Contenido del mapa
Statistics
Defintitions
- Data
- Observations that are collected
- Population
- Complete collection of all elements that are to be considered
- Census
- Collection of data from every member of the population
- Sample
- Sub-collection of members selected from a population
- Parameter
- A numerical measurement describing some characteristic of a POPULATION
- Statistic
- A numerical measurement describing some characteristic of a SAMPLE
- Distribution
- The nature/shape of the spread of the data over the range of values.
- Centre
- A representative or average value that indicates where the middle of the data set is located
- Variation
- A measure of the amount that the data values vary among themselves
- Data
TYpes of data
- Quantitative data
- Consists of numbers representing counts or measurements
- e.g The number of products made by a company over a year
- Discrete data – When the number of possible values is either a finite number or a ‘countable’ number
- e.g The number of eggs a hen lays (a hen can’t lay part of an egg)
- Continuous data – When the result has infinitely many possible values, over some continuous scale
- e.g The amount of gallons of milk a cow can produce (on a range from 0-5 gallons, the cow could produce (for example) 3.8657 gallons) or The weight of a person (between 0.1 -280 kg)…
- Classifying data using “fewer” and “less” words (naturally), “fewer” for discrete amounts “less” for continuous amount.
- Qualitative data (Categorical / attribute data)
- May be separated into different categories that are distinguished by some non-numeric characteristic
- e.g The genders of a class of university students
- Distinguishing Types of Data
- Nominal level of measurement
- Characterised by data that consists of names, labels, or categories only.
- – The data can’t be arranged in an ordering scheme, such as low to high !!!!
- e.g Colours: Black, Blue, Red, White, Green
- Ordinal level of measurement
- This consists of data that can be arranged in some order, but data differences cannot be detected or are meaningless
- Examples: * Course Grades: A, B, C, D » We know an A is higher than a B, but we cannot subtract B from A to determine the difference between the two
- Interval level of measurement
- Same as ordinal, but data differences can be detected between any two values and are meaningful However, data at this level do not have a natural zero starting point (where none of the quantity is present)
- – Example: * Temperature difference between two set temperatures » Since 0 degrees Celsius has been chosen arbitrarily by humans, it is not a natural zero point, where no heat exists
- Ratio level of measurement
- Same as interval, but with a natural zero starting point present
- Example: * Price of a pint of milk » £0.00 represents no cost, whereas £1.20 represents a pint of milk that is three times as costly as a £0.40 pint of milk
- Nominal level of measurement
- Quantitative data
Design of Statistical Experiments
- Design of statistical experiments is a key method to collect sample data for statistical analysis, of particular importance is the simple random sample. If sample data are not collected in an appropriate way, the data may be so completely useless that no amount of statistical torturing can salvage them.
- Data can be obtained from two distinct sources:
- Observational study – Observe and measure specific characteristics, but don’t attempt to modify the subjects studied
- Retrospective studies – Data collected from the past (e.g. examine old records)
- Cross-sectional study – Data are observed, measured, and collected at one point in time
- Prospective (or longitudinal) study – Go forward in time and observe groups sharing common factors (such as smokers)
- Experiments – Apply some treatment and then proceed to observe its effects
- Avoid confounding – This occurs when in an experiment you are not able to distinguish among the effects of different factors
- Experiments should be planned so that confounding does not occur 1. Control the effects of variables 2. Use replication 3. Use randomization
- Control the effects of variables
- Blinding – An investigator reviews and assesses outcome without knowing which particular treatment has been applied (removes bias)
- Completely Randomized Experimental Design – Subjects are assigned to different treatment groups through a process of random selection
- Rigorously Controlled Design – Subjects are carefully chosen so that those given each treatment are similar in the ways that are important to the experiment
- Matched Pairs Design – Compare exactly two similar treatment groups by using subject matched in pairs that are somehow related or have similar characteristics.
- Replication and Sample Size
- Samples should be large enough so that the erratic behaviour of small samples does not disguise the true effects of different treatments
- Repetition of an experiment on sufficiently large groups of subjects is called replication
- Randomization and Other Sampling Strategies
- Random sample • Members from a population are selected so that each individual member has an equal chance of being selected
- Simple Random Sample – Of n subjects, every possible sample of the same size n may be chosen
- Probability Sample – Selecting members in such a way that each member has a known (but not necessarily the same) chance of being selected
- Other Sampling Methods
- Systematic Sampling • Select some starting point, then select every k th (such as every 3rd , 5th ,…, 100th etc.) element in the population
- Stratified Sampling • Subdivide the population into at least two subgroups (e.g. gender/age bracket) (based on a common characteristic), and draw a sample from each
- Cluster Sampling • Divide the population in sections, and then randomly select some of those clusters, and choose all members from those selected clusters
- Sampling Errors
- Sampling Error • The difference between a sample result and true population result
- Non-sampling error • Occurs when the sample data are incorrectly collected, recorded, or analyzed
- Random sample • Members from a population are selected so that each individual member has an equal chance of being selected
- Observational study – Observe and measure specific characteristics, but don’t attempt to modify the subjects studied
Frequency Distributions
- A Frequency distribution (FD) / Frequency table helps us to understand the nature of the distribution of a data set,
- Lists data values along with their corresponding frequencies,
- Procedure for creating a frequency distribution
- 1. Decide the number of classes you want (between 5-20)
- 2. Calculate class width using formula:
- 3. Choose a lower limit starting point - either the minimum data value or a convenient value below th
- 4. Using chosen lower limit, and calculated class range, list the other lower class limits
- 5. Assign each data value to its correct class, and tally the marks to get the frequency
- 4. Using chosen lower limit, and calculated class range, list the other lower class limits
- 3. Choose a lower limit starting point - either the minimum data value or a convenient value below th
- 2. Calculate class width using formula:
- 1. Decide the number of classes you want (between 5-20)
- Relative Frequency Distribution
- Cumulative Frequency Distribution
- The sum of frequencies for that class, plus all previous classes
Graphs
- Histograms
- A bar graph with the horizontal scale representing classes of data values, and the vertical scale representing frequencies
- Heights of the bars correspond to the frequency values
- Bars are drawn adjacent to each other, without gaps
- Ogive
- A line graph that depicts cumulative frequencies
- Pie Chart
- • Can also be used to depict qualitative data, by means of ‘slices of pie’
- Histograms
Statistics for: Describing, Exploring, and Comparing Data
- Measures of Centre
- Arithmetic Mean
- The mean has one main disadvantage: it is particularly susceptible to the influence of outliers. These are values that are unusual compared to the rest of the data set by being especially small or large in numerical value.
- Median
- 1. Arrange values in order 2. If the number of values is odd, the median is the middle number; if the number of values is even, the median is found by computing the mean of the middle two numbers.
- The median is less affected by outliers and skewed data.
- Mode
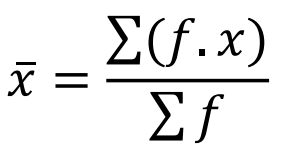
- Mean from a Frequency Distribution
- Since in a frequency distribution we don’t know the exact values falling in a particular class, we pretend that all values of a particular class are = class midpoint Mean of a Frequency Distribution (shown with x-bar (ݔҧ))
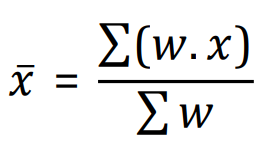
- Weighted Mean
- Sometimes values will have different degrees of importance, so we must weight them
- Range
- The difference between the maximum and the minimum value.
- Standard Deviation
- a measure of variation of values about the mean
- Arithmetic Mean
- Measures of Centre
Imágenes y archivos del mapa

Información
- Descripción
- Mapa Mental sobre Statistics, creado por Henry Yannaghas el 30/12/2019.
- Creado por
- Henry Yannaghas
- Visitas
- 3
- Valoración