
Apuntes
Stats Year 2 Chapter 1
Contenido del apunte (3)
Página 1
Regression
What is regression?
Regression is the statistical measure used to determine the strength of relationship between the x and y variables. Depending on the graph you will need to use linear regression or exponential regression to plot the regression line or regression curve.
Logarithms and coding can be used to examine trends in non-linear data.
Linear regression
Linear regression follows the form y = bx + a, and is used when it is best to plot a linear regression line.
Exponential regression
Exponential regression can follow the form y = ax^n
log(y) = log (ax^n)
log(y) = log(a) + nlog(x)
Or
Exponential regression can follow the form y = kb^x
log(y) = log (kb^x)
log(y) = log(k) + xlog(b)
and they can both be used when it is best to plot a curved regression line, dependant on the question given.
How do you change y = ax^n into a linear relationship when a and n?
You would have to to use coding where Y = log(y) and X = log(x) to find the linear relationships
How do you change y = kb^x into a linear relationship when k and b?
You would have to to use coding where Y = log(y) and X = x to find the linear relationships
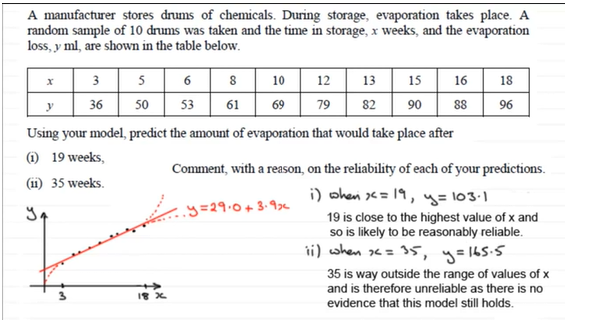
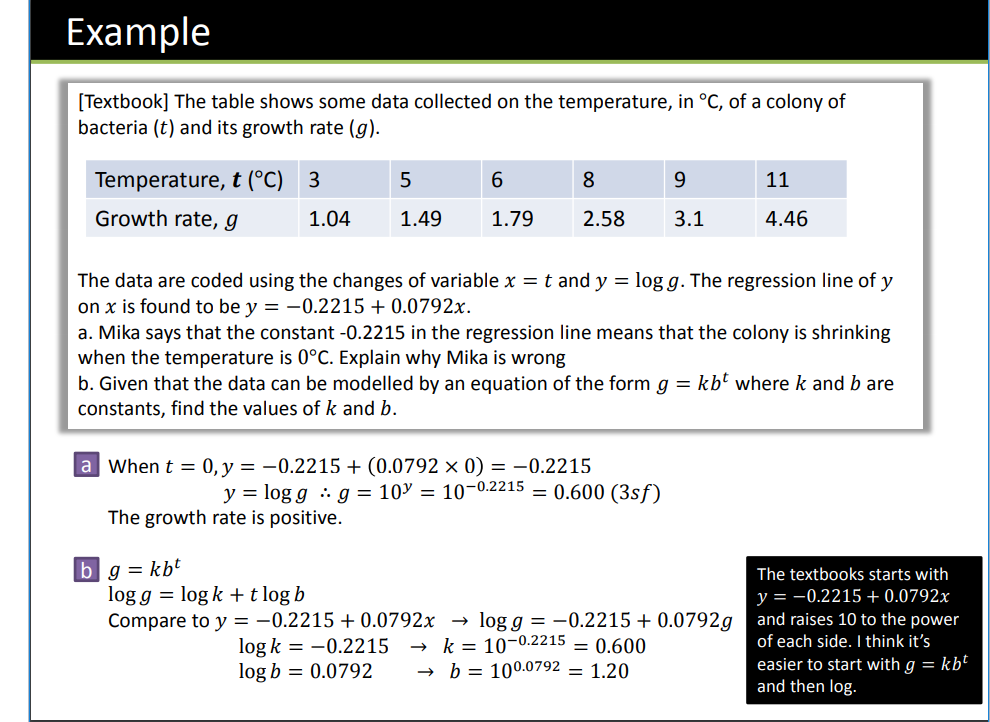
Examples
Página 2
Correlation
Product moment correlation coefficient (PMCC)
The PMCC is given the notation of r, and it describes the linear correlation between two variables. It can take values between -1 and 1.
PMCC can only be used for linear correlation i.e determining the strength of linear regression lines
We usually associate strong correlations with values of r > 0.7 and r < -0.7
We usually associate weak correlations with values of -0.3 < r < 0.3 (excluding 0)
We usually associate no correlations with value of r = 0 and perfect correlation with r = 1
How do you calculate PMCC on your calculator?
Press mode,
Then press 6
Then 2 and input the table given
Once you have input the table values press the OPTN button under the shift button
Then press 4
This will bring up the a and b values for y = a + bx and the PMCC (r) value
Página 3
Hypothesis testing
The notation rho (ρ) is given to the population PMCC. When conducting hypothesis test, r represents the sample size and ρ represents the whole population, we can therefore say r is the test statistic and ρ is the population parameter.
ρ always equals to 0 as we are assuming there is no correlation between the two variable, This would represent the H0:
ρ can be greater(>) or less (<) than 0 dependant on the question and which you're trying to prove, this would represent H1: for a 1 tail test
ρ can also be not equal (≠) 0, used where there is no correlation suggests, This would represent a H1: for a two tail test
One Tail Test
The table from the large data set shows the daily maximum gust, xkn, and the daily maximum relative humidity, y%, in Leeming for a sample of eight days in May 2015
x / 31 / 28 / 38 / 37 / 18 / 17 / 21 / 29 /
y / 99 / 94 / 87 / 80 / 80 / 89 / 84 / 86 /
a) Find the PMCC for this data
b) Test at a 10 significance level, where there is evidence of positive correlation between the daily maximum gust and the daily maximum relative humidity and state your hypothesis clearly.
a) r = 0.1149
b)
First write down the H0: and H1: values, for a two tail test it will always be H0: ρ = 0 and H1: ρ > 0.
Second count the sample size. For this question it would be 8. (This is so we know where to look in table of critical values).
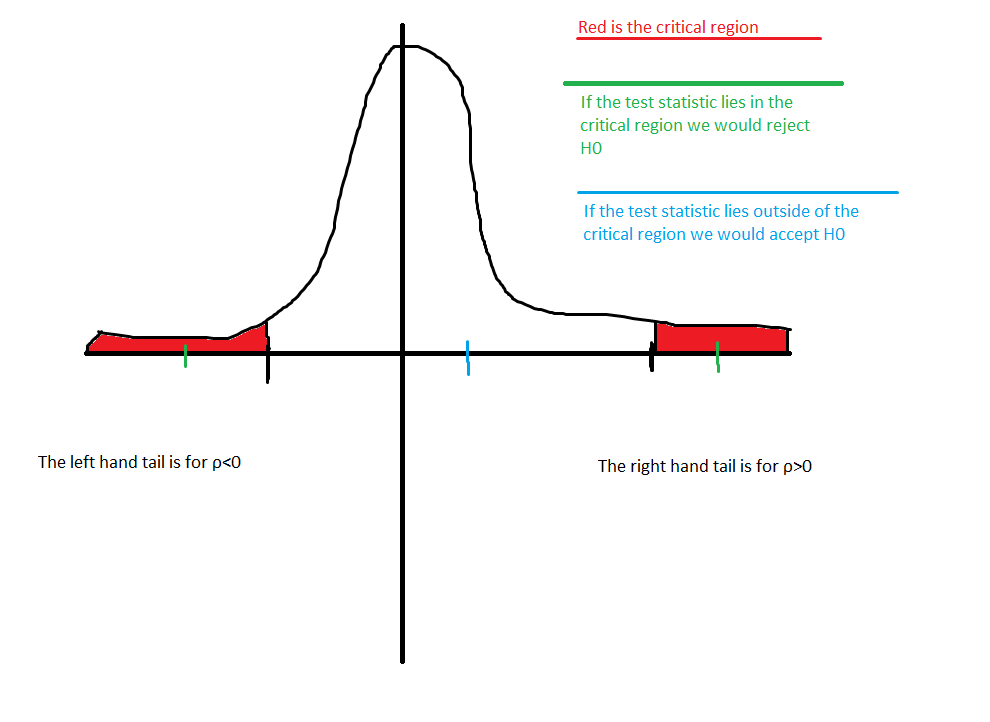
Because it is a one tail positive test this means we will be looking at the right hand tail so the right hand tail will have a significance level of 10%
Now you have the number of samples and the significance level we can look at our table of critical values and find the corresponding value. Which would be
The value of 0.5067 tells us that we have a critical value of 0.5067 for the right tail
We can give this the notation r as we will compare it with the test statistic to conclude our hypothesis.
0.1149<0.5067. This tells us that the test statistic does not lie in the critical region so we would reject H1: and accept H0:
So we can conclude by saying which we would reject and accept, and relate it to the question when explaining why there is or is not correlation.
H0: ρ = 0 and H1: ρ > 0
Sample size = 8. Because it is a 1 tails test 10% is the right hand tail
(Look down 8 at a 10% on the PMC table for critical values to find the value of r = 0.5067)
r = -0.45, so 0.1149<0.5067
Because the test statistic is not in the critical region we would reject H1: and accept H: this is because at a 10% significance level there is insufficient evidence to show that there is a correlation between the maximum gust and maximum humidity.
Two tail test
A scientist takes 30 observatiosn of the masses of two reactants in an experiment. She calculates a PMCC of r = -0.45.
The scientist believes there is no correlation between the two masses of the two reactants. Test at the 10% significance level, the scientist's claims, stating your hypothesis clearly.
First write down the H0: and H1: values, for a two tail test it will always be H0: ρ = 0 and H1: ρ ≠ 0.
Second count the sample size. For this question it would be 30. (This is so we know where to look in table of critical values).
Because it is a two tail test you would have to half the significance level. Meaning the right hand tail and left hand tail would both be 5% (This is because we want to work out both tails to see if there is negative or positive correlation).
Now you have the number of samples and the significance level we can look at our table of critical values and find the corresponding value. Which would be ±0.3061.
The value of 0.3061 tells us that we have a critical value of 0.3061 for the right tail and -0.3061 for the left tail.
We can give this the notation r as we will compare it with the test statistic to conclude our hypothesis.
-0.45<-0.3061 and -0.45<0.3061. This tells us that the test statistic does lie in the critical region so we would reject H0: and accept H1:
So we can conclude by saying which we would reject and accept, and relate it to the question when explaining why there is or is not correlation.
H0: ρ = 0 and H1: ρ ≠ 0
Sample size = 30. Because it is a 2 tails test 10%/2 = 5% each tail.
(Look down 30 at a 5% on the PMC table for critical values to find the value of r = ±0.3061)
r = -0.45, so -0.45<-0.3061 and -0.45<0.3061.
Because the test statistic is in the critical region we would reject H0: and accept H1: this is because at a 10% significance level there is insufficient evidence to show that there is not a correlation between the two masses reacted.
Información
- Descripción
- A level (Stats) Maths Apunte sobre Stats Year 2 Chapter 1, creado por BUKDABOSS . el 08/11/2018.
- Creado por
- BUKDABOSS . · nov 2018
- Actualizado
- 12 nov 2018
- Visitas
- 6
- Valoración