
Test
Stats
Crea una cuenta gratis para terminar este test
Guarda tu progreso y consulta tu resultado final.
¿Ya tienes cuenta? Inicia sesión
Preguntas del test (35)
1A company has three divisions and three conference rooms for meetings. To keep track of the use of their facilities, for each meeting held in the company, the division holding the meeting is recorded, and the length of time of the meeting is recorded. Which of the following is quantitative?
- AThe division holding the meeting
- BThe conference room for the meeting
- CThe length of time for the meeting
- DAll of the answer options are correct
2A description of different houses for sale includes the following variables. Which of the variables are categorical?
- AThe square footage of the house
- BWhether or not the house has a finished basement
- CThe monthly electric bill
- DAll the answer options are correct
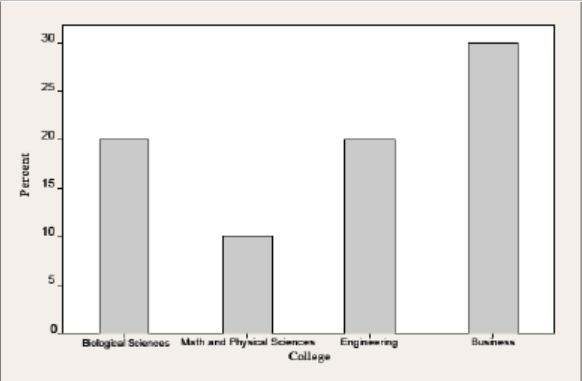
3A large university is divided into six colleges, with most students graduating from four of these colleges. The following bar chart gives the distribution of the percent of students graduating from the four most popular colleges in 2003. The percent of students graduating from either engineering or business is:
- AApproximately 30%
- BApproximately 40%
- CApproximately 50%
- DOver 60%
4A large university is divided into six colleges, with most students graduating from four of these colleges. The following bar chart gives the distribution of the percent graduating from the four most popular colleges in 2013. Which statement is CORRECT?
- AA time plot of the 2003 distribution would be more informative
- BThe bar graph is skewed to the right
- CThe bar graph is skewed to the left
- DNone of the answers are correct
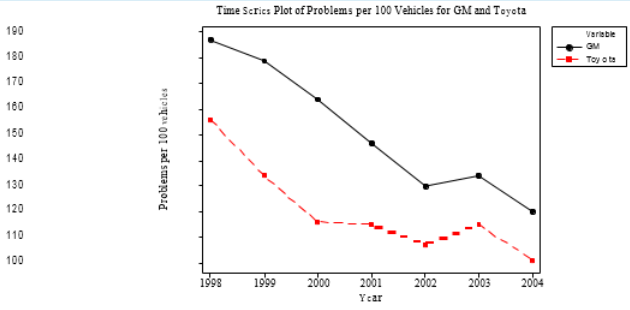
5A poll was conducted of more than 50,000 buyers of new cars, 90 days after the car's purchase. The data on problems per 100 vehicles for vehicles made by Toyota and General Motors are given in the time plot below for the years 1998-2004. The solid line is for General Motors, and the dashed line is for Toyota. In 2002, the number of problems per 100 vehicles was:
- AAbout twice as high for General Motors as for Toyota
- BAbout twice as high for Toyota than for General Motors
- CAbout 20% higher for Toyota than General Motors
- DAbout 20% higher for General Motors than for Toyota
6A poll was conducted of more than 50,000 buyers of new cars, 90 days after the car's purchase. The data on problems per 100 vehicles for vehicles made by Toyota and General Motors are given in the time plot below for the years 1998-2004. The solid line is for General Motors, and the dashed line is for Toyota. Which statement is TRUE?
- AThe quality of cars is getting poorer for both companies
- BThe number of problems was higher for General Motors than for Toyota in each year
- CThe difference in the number of problems per 100 vehicles between General Motors and Toyota is less than 30 for each year
- DAll of the answer options are correct
7As part of a database of new births at a hospital, some variables recorded are the age of the mother, marital status of the mother (single, married, divorced), Weight of the baby, and sex of the baby. Of these variables, which is correct:
- AThe individuals described are mothers and babies involved in births at a hospital
- BAge of the mother and weight of the baby are quantitative variables
- CSex and marital status are categorical variables
- DAll of the answer options are correct
8Employees at a large company are surveyed about their health insurance status. Employees are coded as "1" if health insurance is obtained through the company's benefit program, "2" if health insurance is obtained from another source (eg. Through a spouse's employment benefit program), or "0" if the employee does not have health insurance. This variable is:
- ANumerical
- BCategorical
- CQuantitatively categorical
- DAll of the options are correct
9Physicians take a sample of smokers and non-smokers and record the time it takes them to fall asleep on seven consecutive nights. What is the individual?
- Athe physicians
- Bthe average time it takes to fall asleep on the seven nights
- Cthe smokers and non-smokers
- Dthe amount of time it takes to fall asleep each night
10Physicians take a sample of smokers and non-smokers and record the time it takes them to fall asleep on seven consecutive nights. What is the variable of interest?
- Athe physicians
- Bthe average time it takes to fall asleep on the seven nights
- Cthe smokers and non-smokers
- Dthe amount of time it takes to fall asleep each night
11In a pollution study water samples from 100 different locations in Lake Champlain were taken and the level of nitrates was measured. What is the individual?
- ALake Champlain
- Ba given location in Lake Champlain
- Cthe level of nitrates measured
- Dthe scientist conducting the study
12In a pollution study water samples from 100 different locations in Lake Champlain were taken and the level of nitrates was measured. What is the variable of interest?
- ALake Champlain
- Ba given location in Lake Champlain
- Cthe level of nitrates measured
- Dthe scientist conducting the study
13The difference between a frequency histogram and a relative frequency histogram is that the relative frequency histogram indicates:
- ACounts on the vertical (y) axis, whereas a frequency histogram indicates percentages
- BCounts on the horizontal (x)axis, whereas a frequency histogram indicates percentages
- CPercentage of observations on the horizontal (x) axis, whereas a frequency histogram indicates counts
- DPercentage of observations on the vertical (y) axis, whereas a frequency histogram indicates counts
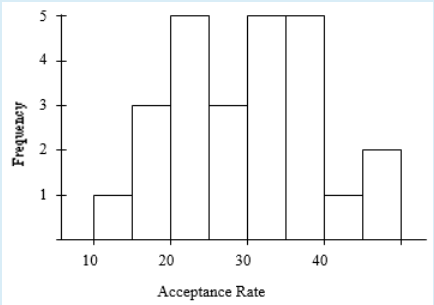
14The following histogram represents the distribution of acceptance rates (percent accepted) among 25 business schools in 2004. In each class interval, the left endpoint but not the right is included, so the class intervals are 10 <(& equal to) rate <15, etc. What is the approximate spread of the data?
- A25
- B30
- C40
- D50
15The following histogram represents the distribution of acceptance rates (percent accepted) among 25 business schools in 2004. In each class interval, the left endpoint but not the right is included, so the class intervals are 10 <(& equal to) rate <15, etc. The number of schools with acceptance rates over 30% is:
- A5
- B12
- C10
- D13
16A data set contains the nutritional content per serving of 77 brands of breakfast cereal. Manufacturer, cold/hot, calories, grams of sugar, and grams of fiber are recorded for each cereal brand. Identify the individual in this data set.
- A77 brands of cereal
- Bmanufacturer
- Cnumber of calories
- Dgrams of sugar and fiber
17A data set contains the nutritional content per serving of 77 brands of breakfast cereal. Manufacturer, cold/hot, calories, grams of sugar and grams of fiber are recorded for each cereal brand. How many quantitative variables have been recorded for each individual?
- A1
- B2
- C3
- D4
18Would the variable “monthly rainfall in Michigan” be considered a categorical or quantitative variable?
- Acategorical
- Bquantitative
19A zoologist keeps a database of all the specimens with which he works. It contains the following fields: phylum, species, gender, length, weight, and location found. How many of the these fields would be considered categorical?
- Athree
- Bfour
- Cfive
- Dsix
20We asked people to classify their weight as underweight, normal, overweight, or obese. Would this variable be a categorical or quantitative variable?
- Acategorical
- Bquantitative
21A clinical trial administrator keeps a database of information on participating subjects. Which of the following variables would be considered as quantitative?
- ACity
- Bstate
- Czip code
- DNone of the above.
22Which graphic would best display the distribution of the top ten causes of death in the United States?
- Abar graph
- Btime plot
- Chistogram
- Dstemplot
23The 2009 National Household Survey on Drug Use and health reported the percent of current users of cannabis using the pie chart below:
Approximately 50% of the users are in which age group?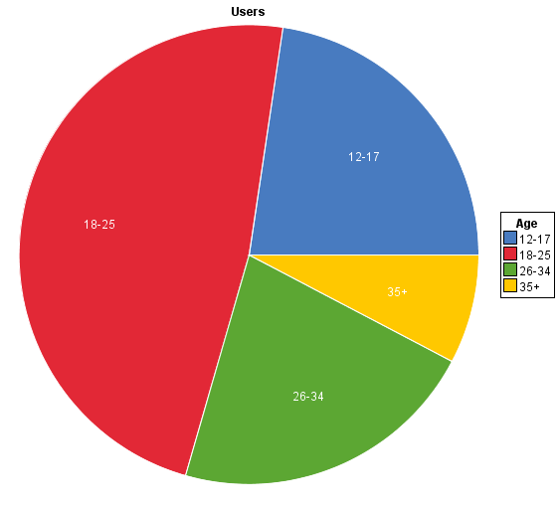
- A12-17
- B18-25
- C26-34
- D35+
24A researcher wants to show the distribution of times it took subjects who smoke to fall asleep. Which graphic would be the best choice?
- Abar graph
- Btime plot
- Chistogram
- Dpie chart
25The width of 70 leaves from Bur Oak trees found in upstate New York were measured. The total of all their lengths was 805 cm. Calculate their mean length.
- A11.0 cm
- B11.5 cm
- C12.0 cm
- D12.5 cm
26The width of 70 leaves from Bur Oak trees found in upstate New York were measured. A stemplot is given to the left. Note, smallest width is 7.2 centimeters and largest width is 13.7 centimeters. Calculate the median.
7 : 2
7 : 6
8 :
8 : 557
9 : 023
9 :
10 : 0023
10 : 778888999
11 : 0134
11 : 55566778888899
12 : 0011122344
12 : 555666678888899
13 : 00122
13 : 7- A11.6 cm
- B11.8 cm
- C11.9 cm
- D12.0 cm
27A violin student records the number of hours she spends practicing during each of nine consecutive weeks
6.2 5.0 4.3 7.4 5.8 7.2 8.4 1.2 6.3
What is the mean number of hours spent practicing per week during this period- A6.15 hours
- B5.76 hours
- C6.20 hours
- D8.40 hours
28A violin student records the number of hours she spends practicing during each of nine consecutive weeks
6.2 5.0 4.3 7.4 5.8 7.2 8.4 1.2 6.3
What is the median number of hours spent practicing per week during this period?- A6.15 hours
- B5.76 hours
- C6.20 hours
- D8.40 hours
29A violin student records the number of hours she spends practicing during each of nine consecutive weeks
6.2 5.0 4.3 7.4 5.8 7.2 8.4 1.2 6.3
What is the first quartile for this data?- A5.00 hours
- B5.76 hours
- C7.20 hours
- D4.65 hours
30A violin student records the number of hours she spends practicing during each of nine consecutive weeks
6.2 5.0 4.3 7.4 5.8 7.2 8.4 1.2 6.3
What is the interquartile range (IQR) for this data?- A3.00 hours
- B2.65 hours
- C3.20 hours
- D1.65 hours
31A violin student records the number of hours she spends practicing during each of nine consecutive weeks
6.2 5.0 4.3 7.4 5.8 7.2 8.4 1.2 6.3
Considering the smallest data value (1.2) and using the 1.5 X IQR rule, we would:- Aclassify the value 1.2 as an outlier because it is more than 1.5 X IQR below the first quartile
- BNot classify the value 1.2 as an outlier because it is not less than 1.5X IQR below the first quartile
- CClassify the value 1.2 as an outlier because it is more than 1.5 X IQR below the median
- DClassify the value 1.2 as an outlier because it is more than 1.5 X IQR below the mean
32A researcher records the number of calories a person consumes per day and that person’s percent of body fat. Identify the explanatory variable(s).
- Acalories consumed per day
- Bpercent of body fat
- Ccalories consumed per day and percent body fat
33How does drinking beer affect the level of alcohol in the blood? Student volunteers at Ohio State University drank different numbers of cans of beer. Thirty minutes later a police officer measured their blood alcohol content. Identify the explanatory variable.
- Astudent’s age
- Bnumber of beers drank
- Cblood alcohol level before drinking beers
- Dblood alcohol level after drinking beers
34Medical researchers at a large city hospital investigating the impact of prenatal care on newborn health collected data from 882 births during 1998–2000. They kept track of the mother’s age and the number of weeks the pregnancy lasted. Which variable should be plotted on the horizontal axis?
- Athe mother’s age because it is the response variable
- Bthe mother’s age because it is the explanatory variable
- Cthe number of weeks that the pregnancy lasted because it is the response variable
- Dthe number of weeks that the pregnancy lasted because it is the explanatory variable
- Eeither variable because there is no explanatory-response distinction
35Describe the relationship between powerboat registration and manatee deaths from powerboat collisions.
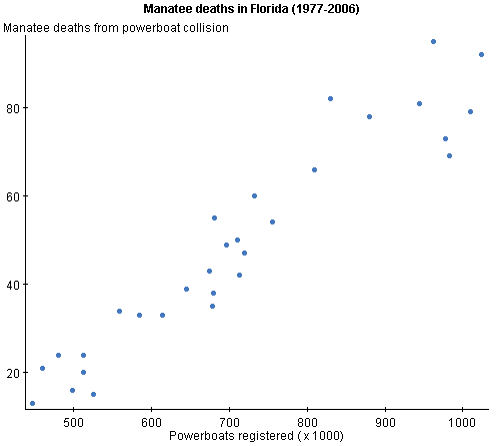
- AThere is a strong negative linear relationship between powerboats registered and manatee deaths.
- BThere is a strong positive linear relationship between powerboats registered and manatee deaths.
- CThere is a weak positive linear relationship between powerboats registered and manatee deaths.
Información
- Descripción
- (Statistics and research) Nursing Test sobre Stats, creado por Kayla Loos el 17/02/2018.
- Autor
- Kayla Loos
- Idioma
- English
- Visitas
- 1
- Etiquetas
- Valoración
- Aún sin valoraciones Valora este test