Gráfico T vs t

Description

Qv Flashcards on Gráfico T vs t, created by Oriana D'ALESSANDRO on 23/03/2020.
Oriana D'ALESSANDRO
Flashcards by Oriana D'ALESSANDRO, updated more than 1 year ago
Oriana D'ALESSANDRO
Created by Oriana D'ALESSANDRO about 4 years ago
344
0

Resource summary

Question Answer
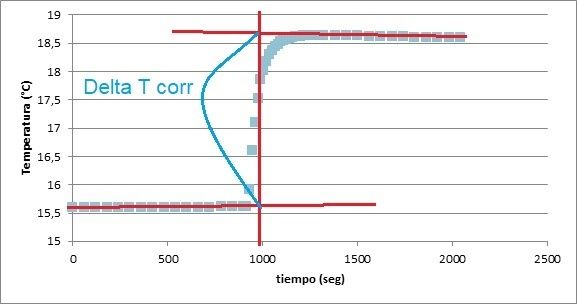
A partir de medidas de T y t de un experimento, se puede obtener este gráfico, mediante el cual se determina el Delta T corregido y el Delta "tita", asociado a la no adiabaticidad del calorímetro
Show full summary Hide full summary

Similar

AQA Core Biology (B1) - 1.1 - Keeping Healthy
NiallRamphal
AS Psychology - Research Methods
kirstygribbin
Of Mice and Men
amyk4321
B3- Science. Cells, Genes and Enzymes.
MissChurro
Of Mice and Men - Themes
Hafsa A
Of Mice and Men Quotes
_Jess_
Input, output and storage devices
Mr A Esch
TOK mindmap “Without application in the world, the value of knowledge is greatly diminished.”
Gabriela Serpa
OCR gcse computer science
Jodie Awthinre
CELLS REVISION
ILHAM HASSAN
Účto Fífa 4/6
Bára Drahošová