
Flashcards
Chapter 11: Analysis and interpretation

Cards in this deck (26)
- 1Fundamental analysis- Analysing many aspects of an entity to assess the entity
- E.g. state of industry in which it operates, financial statements, management/governance, competitive positioning - 2Financial analysis- Analysing reported financial numbers to form opinions as to the entity’s past and future performance and position
- Involves expressing the reported financial numbers in relative terms (ratios) - 3Nature and purpose of financial analysis- Relying on absolute values in financial statements is not meaningful when trying to evaluate an entity’s past decisions and to predict future rewards and risks
- Financial analysis involves comparing figures to equivalent figures from previous years and other figures in the financial statements - 4Horizontal analysis- Analysing a series of financial statement data over a period of time
- Compares figures for current period with previous period e.g. absolute dollar change, percentage change - 5Trend analysis- Examining changes, movements and patterns in data over a number of time periods
- At least 3 years of data needed
- Expresses the item in subsequent years relative to a selected base year
- To calculate index, each figure is divided by base year figure and multiplied by 100 - 6Vertical analysis- Analysing financial statement data by expressing each item as a percentage of a base amount
- Compares to another item (anchor point) in the same financial statement (known as ‘common size’ statements)
- Income statement: anchor point is revenue figure
- Balance sheet: anchor point is total asset figure - 7Ratio analysis- An examination of the relationship between two quantitative amounts with the aim of expressing the relationship in ratio or percentage form
- Compares one item in a financial statement relative to another item in a financial statement
- When comparing stock (as at a point in time) and flow (generated over a period of times) items, average of the stock item is used instead of the year-end figure i.e. beginning and ending year value are added divided by two - 8Process of ratio analysis1. Calculate a meaningful ratio by expressing the dollar amount of a financial statement item by the dollar amount of another financial statement item
2. Compare the ratio with a benchmark
3. Interpret the ratio and explain why it differs from previous years, comparative entities or industry averages - 9Usefulness of ratios is limited unless compared to a benchmark such as...- Comparison of entity's ratios over time to identify trends
- Comparison with other entities in the same industry (intra-industry analysis)
- Comparison with industry averages
- Comparison with entities in different industries (inter-industry analysis)
- Comparison - with arbitrary standards - 10Ratio analysis can be grouped into...1. Profitability ratios
2. Efficiency ratios
3. Liquidity ratios
4. Capital structure ratios
5. Market performance ratios - 11Profitability analysis1. ROE
2. ROA
3. Gross profit margin
4. Profit margin
5. Cash flow to sales ratio - 12Asset efficiency analysis1. Asset turnover
2. Days inventory
3. Days debtors - 13Asset efficiency: asset turnover- Measures efficiency in generating sales revenue using current and non-current assets
- Higher is more favourable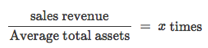
- 14Asset efficiency: days inventory- Indicates average time it takes for an entity to sell its inventory
- Helps forecast liquidity
- Shorter is more favourable
- Can be decreased by lowering prices; purchasing less inventory - 15Asset efficiency: days debtors- Indicates average time it takes for an entity to collect the money from trade receivables
- Helps forecast liquidity
- Shorter is more favourable
- Can be decreased by reviewing recollection policies e.g. discounts, shortening credit period
- 16Liquidity analysis1. Current ratio
2. Quick ratio
3. Cash flow ratio - 17Liquidity: current / working capital ratio- Measures dollars of current assets available to service a dollar of current liabilities
- Higher if more favourable
- Can be increased by reviewing debt structure e.g. replace short-term debt with long-term debt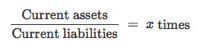
- 18Liquidity: quick / acid-test ratio- Measures dollars of current assets available (excluding inventory) to service a dollar of current liabilities
- More accurate than current ratio as it excludes a current asset that may not be able to be converted to cash quickly
- Higher is more favourable
- Can be increased by reviewing debt structure
- 19Capital structure analysisCapital structure ratios:
1. Debt ratio
2. Equity ratio
3. Debt to equity ratio
Interest-servicing ratios:
4. Interest coverage ratio
5. Debt coverage ratio - 20Capital structure analysis: interest coverage ratio / times interest earned- Indicates ability of the entity's profit to cover interest expense
- Measures number of times an entity’s existing EBIT covers net finance costs
- Inversely related to an entity’s financial risk --> higher is more favourable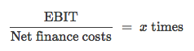
- 21Market performance analysisRatios that relate the entity’s financial numbers to the entity’s share price
1. Net tangible asset backing (NTAB) per share - book value of the company’s tangible assets per ordinary share on issue
2. Earnings per share (EPS)
3. Operating cash flow per share - net cash flows from operating activities available to pay dividends and fund future investments
4. Dividend per share
5. Payout ratio
6. Price earnings ratio - how much an investor would have to pay in the market for each dollar of earnings - 22Market performance: EPS- Converts absolute dollar amount of profit to a per-share basis
- Indicates profit earned per share issued
- Higher is more favourable - 23Market performance: DPS- Indicates distribution of company's profits
- Expresses dividends relative to number of ordinary shares on issue - 24Market performance: payout ratio- Measures percentage of profits distributed in the form of dividends

- 25Ratio interrelationshipsDu Point analysis:
- ROA = PM x asset turnover ratio
- PM is affected by gross profit margin and expense ratio
- Asset efficiency depends on efficient management of inventory and debtors - 26Limitations of ratio analysis1. Quality - errors in financial statements are transferred to ratio calculations; required information may be outdated or not disclosed
2. Accounting standards and policy choices impede comparability with other entities or over time
3. Don’t use in isolation - use other sources (e.g. financial newspapers) and consider social/environmental performance
4. Financial statements are historical data so this should be considered when trying to make predictions about the future
Information
- Description
- Business/Economics (ACC1200: Accounting for Managers) Flashcards on Chapter 11: Analysis and interpretation, created by Melina Mackey on 21/05/2018.
- Created by
- Melina Mackey
- Views
- 2
- Rating