16137055
Description
Flashcards by Daniel Gomez-Windshuttle, updated more than 1 year ago
|
|
Created by Daniel Gomez-Windshuttle
about 7 years ago
|
|
| Question | Answer |
| Lag | Waiting time between activities (positive time). |
| Lead | Activities are moved closer together or overlap (negative time). |
| Crashing: | Adding resources to reduce the project duration. Crashing adds costs to the project. |
| Fast Tracking | Allows project phases to overlap to reduce the project duration. Fast tracking adds risk to the project. |
| Free Float | The amount of time an activity can be delayed without delaying the next activity’s start date. |
| Total Float | The amount of time an activity can be delayed without delaying the project’s end date. |
| Finish to start (FS) | This relationship means Task A must complete before Task B can begin. This is the most common relationship. |
| Start-to-start (SS): | This relationship means Task A must start before Task B can start. This relationship allows both activities to happen in tandem. |
| Finish-to-finish (FF): | This relationship means Task A must complete before Task B does. Ideally, two tasks must finish at exactly the same time, but this is not always the case. |
| Start-to-finish (SF): | This relationship is unusual and is rarely used. It requires Task A to start so that Task B may finish. It is also known as just-intime (JIT) scheduling. |
| Steps to find float | 1. add up path durations 2. identify critical path 3. forward pass: early starts & finishes 4. drop in late finishes on critical path 5. backward pass 6. subtract late finishes from early finishes (should match LS - ES) |
| Formulas: 4 Definitions | EV: project is worth, actual % complete PV: planned project worth, planned % complete AC: money spent so far BAC: baseline budget |
| 3 Variances | Cost variance = EV - AC Schedule variance = PV - EV Variance at completion (VAC): BAC - EAC negative = over budget or behind schedule |
| 2 Performance Indexes | Cost Performance Index (CPI) = EV / AC Schedule Performance Index (SPI) = EV / PV <1 = bad: over budget or schedule |
| 3 x EAC formulas | EAC (standard) = BAC/CPI EAC (EV) = AC + BAC - EV EAC (CPI, SPI) = AC + (BAC - EV)/(CPI x SPI) |
| Estimate to complete (ETC) | ETC = EAC - EV |
| 2 predictive indexes | TCPI (BAC) = (BAC-EV)/(BAC-AC) TCPI (EAC) = (BAC-EV)/(EAC-AC) <1 = GOOD: more likely to reach target |
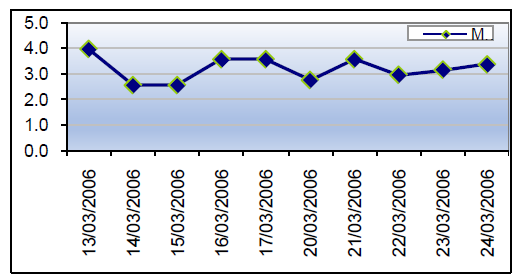
| Run Chart | |
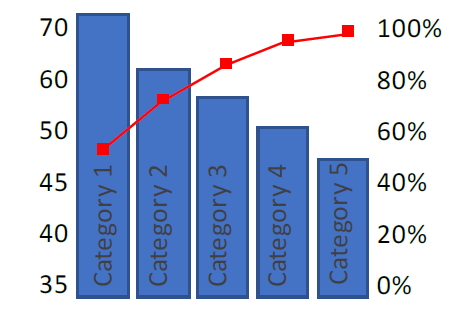
| Pareto chart | |
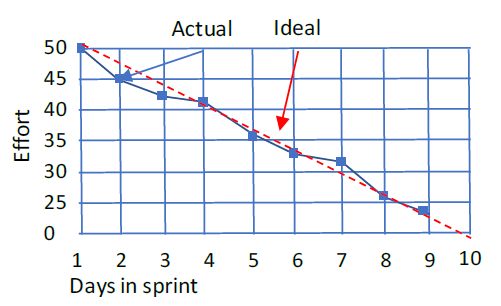
| Burn Down chart | |
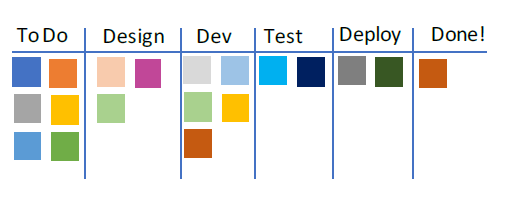
| KANBAN board | |
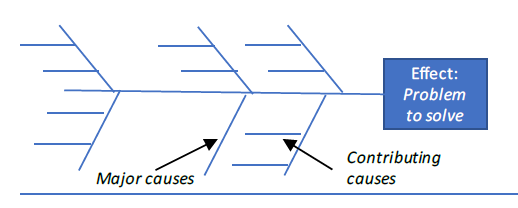
| ISHIKAWA chart AKA fishbone chart AKA root cause chart | |
| Quality | is a conformance to requirements and a fitness for use. It is fulfilling the project scope. |
| Grade | Grade is a category or rank given to entities having the same functional use but different technical characteristics. |
| Gold plating | Gold plating is the process of adding extra features to drive up costs and consume the budget. |
| Quality assurance | Quality assurance is a prevention-driven process to do the project work right the first time. |
| Quality control | Quality control is an inspection-driven process to keep mistakes from entering the customers’ hands. |
| Scope creep | Scope creep is the addition of small, undocumented changes that bypass the scope change control system. Scope creep is sometimes called project poison. |
| Cost of poor quality | Cost of poor quality, also known as the cost of non-conformance to quality, is the cost of not achieving quality: rework, loss of life or limb, loss of sales. |
| Defect Prevention | Prevention aims to keep errors out of the process. |
| Inspection | Inspection aims to keep errors away from customers. |
| Attribute sampling | Attribute sampling shows if the results conform to requirements or not. Variable sampling shows the degree of conformity. |
| Tolerances | Tolerances demonstrate the range of acceptable results. |
| Maslows Heirarch of Needs | 1. Physiological. We need air, food, clothing, and shelter. 2. Safety. We need safety and security. 3. Social. We need friends, approval, and love. 4. Esteem. We need respect, appreciation, and approval. 5. Self-actualization. We need personal growth, knowledge, and fulfillment. |
| Herzberg’s Theory of Motivation | Hygiene agents are expectations for employment: paycheck, insurance, safe working environment. Motivating agents are motivators for employees such as bonuses, career advancement, opportunity to grow. Hygiene agents will not motivate, but their absence will de-motivate. |
| Halo Effect | All opinions are formed by one component. A great engineer doesn’t always make a great project manager. |
| Parkinsons Law | Parkinson’s Law Individuals allow their work to consume all of their time. Work will expand to fill the amount of time allotted to it. |
| McGregor’s X and Y | Management’s perspective of employees. X people are bad, lazy, and need to be micromanaged. Y people are self-directed. Most managers have X and Y attributes. |
| Ouchi’s Theory Z | Workers do well if motivated. This provides participative management, familial work environment, and lifelong employment. Known as Japanese Management Style. |
| McClelland’s Theory of Needs | Needs are acquired over time and are shaped by life experiences. Our needs are categorized as achievement, affiliation, and power. McClelland used a Thematic Apperception Test (TAT) to determine an individual’s needs. |
| Vroom’s Expectancy Theory | People behave based on what they believe (expect) their behavior to bring them. |
| Key Project Manager Powers | Expert Reward Formal Coercive Referant |
| 8 Risk Responses | -ve: Escalate Mitigate Transfer Avoid Accept +ve: Enhance Share Exploit |
| Contingency fund | An amount of funds used to offset a project’s risks. |
| Secondary risks | A risk response creates another risk. |
| Residual risks | Risk response may create small generally accepted risks. |
| Triggers (of risk responses) | Triggers: Condition, event, or warning sign that a risk is about to happen. Usually “triggers” a risk response. |
| Positive risk | Risks with a positive impact; also called opportunities. |
| Negative Risk | Negative risks: Risks with a negative impact; also called threats. |
| Pure Risk | Pure risk: Only offers a negative impact (injury, fire, theft, destruction). |
| Business Risk | Offer an upside or a downside. |
| Qualitative analysis | Qualifying the risks for legitimacy. |
| Quantitative analysis | Quantifies the risk exposure. |
| Utility function AKA Risk Tolerance | A person’s or organization’s willingness to accept risk. Relative to the project priority as high-priority projects are typically risk adverse. Also known as risk tolerance. |
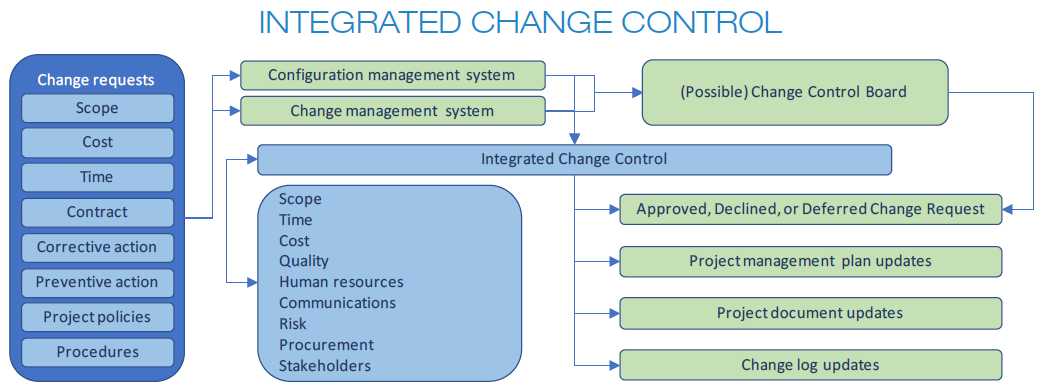
| Describe the Integrated Change Control Process Flow Diagram | |
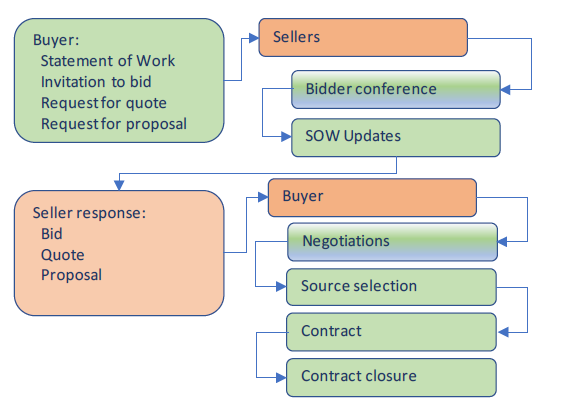
| Describe the procurement process diagram |
Want to create your own Flashcards for free with GoConqr? Learn more.