
16299213
Description
| Question | Answer |
| Quantitative variable | a variable that takes on numerical values for which arithmetic operations such as differences and averages makes sense - ex. height, weight, IQ, income |
| Qualitative variable | records to which of several groups or categories an individual belongs - ex. marital status, class, occupation, eye color |
| Distribution of Data | the arrangement of data |
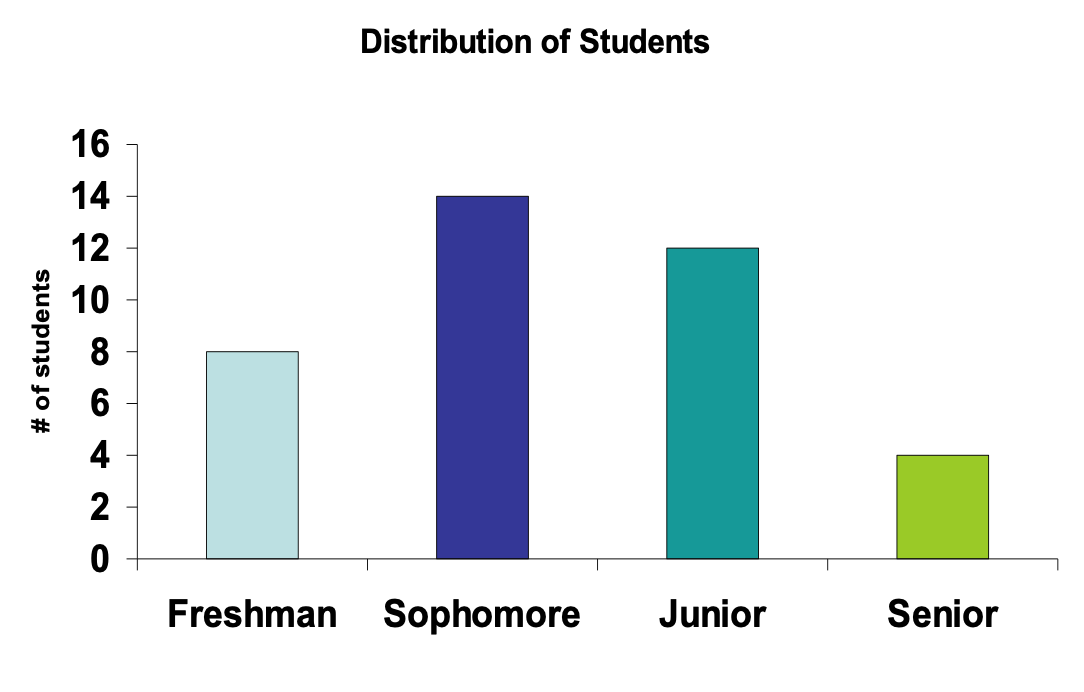
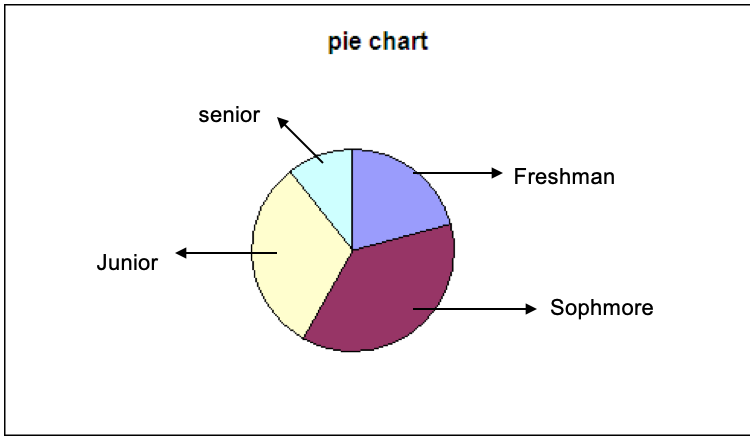
| Bar Graphs / Pie Charts | used to graphically display the distribution of a categorical variable |
| Categorical variable | a variable that can take one of a limited, and usually fixed number of possible values |
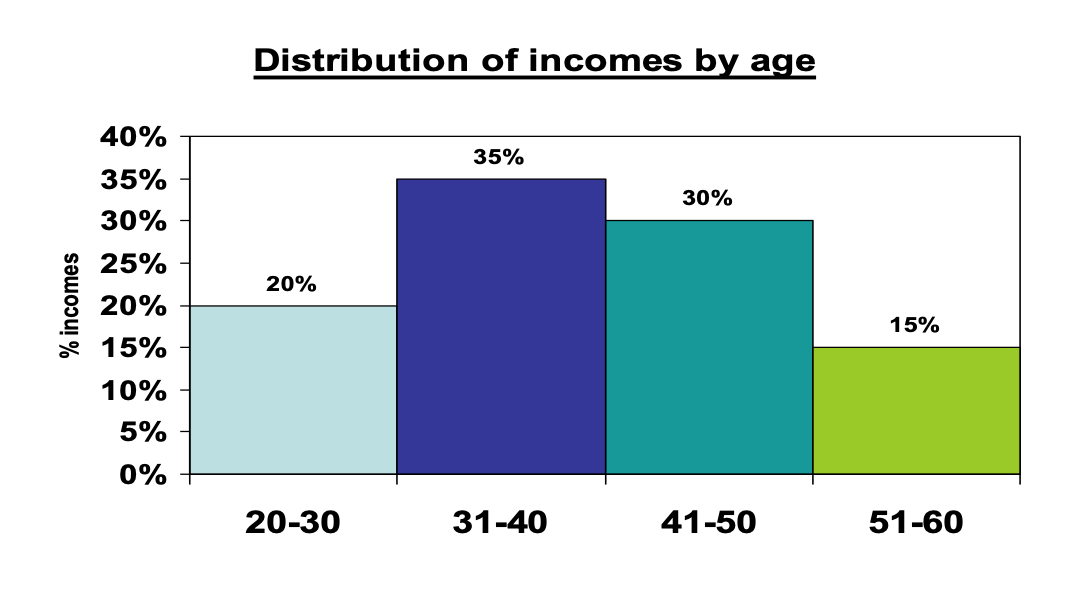
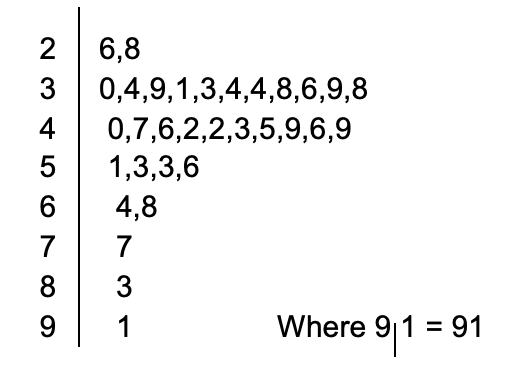
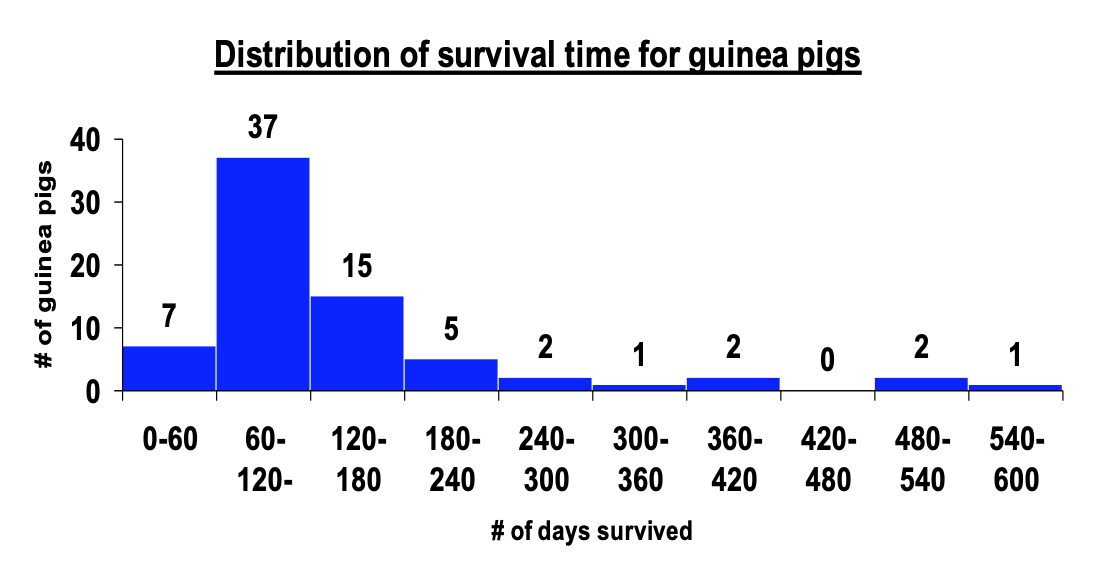
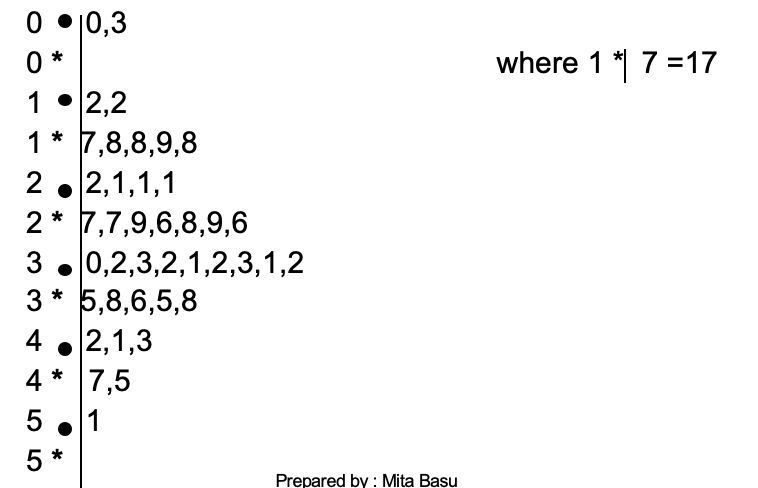
| Histograms / Stem and Leaf plots | used to graphically display the distribution of a quantitative variable |
| Creating a Histogram | Step 1: Range = Max - Min Step 2: # of class intervals = sqrt(n) where n is number of values Step 3: Length of intervals = Range/# of intervals Step 4: Tally frequency/count and/or % for each class interval |
| Interpreting Histograms | Look at histogram to detect overall pattern and shape Shape --> symmetry, skewness, bimodal Distribution --> shape, center, spread, outliers |
| Extended Stem and Leaf plots | Asterisk = leaf digits beginning with 0 through 4 Bullet = leaf digits beginning with 5 through 9 |
0 comments
Want to create your own Flashcards for free with GoConqr? Learn more.