3537602
Description
Flashcards by Georgia Tan, updated more than 1 year ago
|
|
Created by Georgia Tan
over 8 years ago
|
|
| Question | Answer |
| What is the imaginary DGP spreadsheet? | It contains all the data records ever produced by the DGP in the past or in the future |
| The fundamental notion behind statistics is that of a _____________ | data generating process |
| The fundamental property of a process is? | repetition |
| Each repetition of the DGP produces a data record for a ______ | new unit of observation |
| What is the difference between Descriptive and Inferential Statistics? | Desp Stats: Using the data to say smthing abt the data Inf Stats: Using the data to say smthing about the process tt generated the data |
| What is a data generating process? | A large but unobserved spreadsheet of data records on observation units, one per row |
| Give an example of a DGP? | Recording employee information when they first join the company - age, education levels..etc..etc |
| What is a random variable? Name the two types of random variables. | It is a variable whose possible values are numerical outcomes of a random phenomenon. discrete and continuous. |
| What is the difference between a random variable and a random vector? | Random variables are single columns of the DGP spreadsheet. Random vectors are multiple columns in a DGP spreadsheet. The variables of a random vector are linked by the units of observation i.e if the order of the columns are shuffled randomly, u loose that link |
| The statistical techniques covered in our mgmt sc course require that the DGP of interest is: | stationary |
| What does saying that the DGP of interest = stationary mean? There are 2 parts to the explanation | It means that: 1. the data doesn't change over time 2. the sequence of the rows in the DGP spreadsheet doesn't matter to us |
| What is a non-stationary process | A DGP where the order of the rows contains impt information; shuffling the rows leads to information loss |
| What can one do to make a DGP stationary? | You can de-trend the data |
| What is the rule of thumb to determine if the DGP is stationary? | 1. The histogram contains as much info as the line graph 2. data does not change over time |
| When do we consider a DGP fully characterized? | When we can make probabilistic predictions about the data it will produce |
| What is the distribution of a DGP? | It is an oracle that can answer any probabilistic question |
| What is the probability as defined or as measured by the DGP? | It is the proportion of all data records in the imaginary DGP with that characteristic |
| What is inferential stats about? | Using an observed part of the DGP spreadsheet (i.e a sample) to infer/say something useful about the unobserved/unattainable full DGP spreadsheet |
| On a spreadsheet, what is a random variable? | A single column of a DGP spreadsheet (the row is the unit of observation) |
| What is a random vector? | multiple columns of a DGP (the columns of a random vector are linked by the unit of observation) Name --> Unit of Observation GMAT, Age, Gender...etc (whole row is the vector) |
| What is the distribution of the random variable? | The range of possible outcomes and their probabilities across this range |
| The histogram of a discrete random variable is sometimes called_____ | the “probability mass function” |
| What does the () Rand functio do? | The rand() function has a “uniform” distribution between 0 and 1 Throws up random decimal numbers b/w 0 and 1 - each no. has the same chance of being selected |
| What is the law of large numbers? | The law guarantees that the observed proportions in data sample “converge” to the proportion in the (possibly infinite) DGP spreadsheet as the sample size of the data increases |
| What fundamental question does the binomial distribution answer? | What’s the chance of n successes in m independent yes/no experiments (aka “trials”)? – The number m of trials is fixed before-hand |
| What’s the chance of n successes in m independent yes/no experiments (aka “trials”) ----> what does independent mean in this case? | That success in one trial won't change the chance of a success in the other trials |
| What is the excel function for Binomial Distribution? | =binom.dist(n,m,p,F/T) |
| =binom.dist(n,m,p,F/T) define each of the letters | n: the number of successes m: the number of trials (fixed) p: probability of success in any trial f/t: either true or false |
| =binom.dist(n,m,p,F/T) What does the formula calculate when you pick False? | If F is FALSE, the formula calculates the probability of exactly n successes in m trials when the success probability in each trial is p |
| =binom.dist(n,m,p,F/T) What does the formula calculate when you pick True? | If F is TRUE, the formula calculates the probability of at most n successes in m trials when the success probability in teach trial is p |
| How do you find the probability of at least n successes in m trials, using =binom.dist(n,m,p,F/T) ?? | 1 minus the probability of at most n-1 successes in m trials (true) |
| What is the difference b/w Poisson and Binomial? | Binomial: No. of trials is fixed (cannot have more successful events than trials) Poisson: A series of Periods over which events can occur is fixed (no obvious maximum number of events) |
| How does the Poisson process relate to the stationarity assumption? | For the Poisson processs, that there is no reason to believe that the average number of arrivals changes from one period to the next |
| What is the excel function for Poisson? | Excel = poisson.dist(x,m,F) |
| Excel = poisson.dist(x,m,F/T) Explain each of the letters | x = no. of events during a period of the chosen length m = av no. of events over past periods of the chosen length f/t = false or true |
| Excel = poisson.dist(x,m,T/F) What does True mean? | If F=TRUE, then the formula calculates the probability of AT MOST x events over a period of the chosen length |
| Excel = poisson.dist(x,m,T/F) What does False mean? | If F=FALSE, then the formula calculates the probability of exactly x events over a period of the chosen length |
| What are the two types of probability questions? | 1. Given cut-off values, what's the probability? 2. Given a probability, what's the cut-off value? |
| When the average number of events, x, is larger than 30, then what happens to the Poisson distribution ? | When the average number of events, x, is larger than 30, then the Poisson distribution is very similar to the normal distribution with mean μ=x and standard deviation* σ=sqrt(x) |
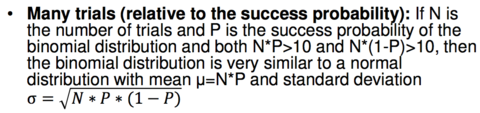
| If N is the number of trials and P is the success probability of the binomial distribution and both N*P>10 and N*(1-P)>10, then what happens to the normal distribution? | |
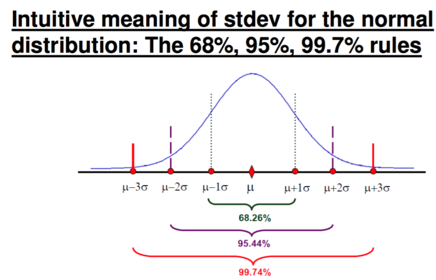
| u +- 1sd u +-2sd u+-3sd | |
| What does the norm.dist formulas calculate? | allows one to calculate probabilities for the normal distribution. |
| =norm.dist (x, mean, stdev, TRUE) - what does this do? | gives one the probability of values below x for a normal DGP with given mean & stddev |
| =norm.inv(p, mean, stdev) what does this do? | gives one the pth percentile of the DGP |
| What is the link b/w a random vector & the percentile curve? | for a random variable, the percentile curve allows one to answer any probability question |
| How do u know if independent variables x and y are truly independent? | 1. when order of columns x & y are shuffled independently, one may still answer any probability qn abt the original DGP w these columns accurately 2. filtering the dgp for specific values of x does not chnge the probabiliy distribution of y |
Want to create your own Flashcards for free with GoConqr? Learn more.