38530518
Description
Flashcards by Summer Davis, updated more than 1 year ago
|
|
Created by Summer Davis
about 3 years ago
|
|
| Question | Answer |
| Statistics | The science of collecting, describing, and analyzing data |
| What are the subjects/objects in a data table called? | cases or units |
| What are the characteristics recorded for each case? | variables |
| Cases are normally tracked using rows or columns? | rows |
| Variables are normally tracked using rows or columns? | columns |
| Categorical variable | divides cases into groups, placing each case into exactly one of two or more categories |
| Quantitative variable | measures or records a numerical quantity for each case |
| Explanatory variable | a variable that helps us understand or predict the values of another variable |
| Response variable | a variable that is understood or predicted by another variable |
| Population | includes all individuals or objects of interest |
| Sample | a subset of a population |
| Statistical inference | the process of using data from a sample to gain information about the population |
| Sampling bias | occurs when the method of selecting a sample causes the sample to differ from the population in some relevant way. |
| How to avoid sampling bias? | Try to obtain a sample that is representative of the population. |
| Simple random sample | The population have the same chance of becoming the sample - avoids sampling bias |
| Bias | exists when the method of collecting data causes the sample data to inaccurately reflect the population |
| Association | Two variables are associated if values of one variable tend to be related to the values of another variable |
| Causation | Two variables are causally associated if changing the value of one variable influences the value of the other variable |
| Confounding variable | (aka: confounding factor/lurking variable) a third variable that is associated with both explanatory and response. Can offer a plausible explanation for an association between two variables of interest. |
| Observational study | a study in which the researcher does not actively control the value of any variable, but simply observes the values as they naturally exist |
| Experiment | a study in which the researcher actively controls one or more of the explanatory variables |
| Randomized experiment | the value of the explanatory variable for each case is determined randomly, before the response variable is measured. |
| 3 Explanations for why an association may be observed in sample data: | 1. There is a causal association 2. There is an association, but it is due to confounding 3. There is no actual association; the association seen in the sample data occurred by random chance |
| Treatments | values of the explanatory variable which the researcher controls |
| Randomized comparative experiment | randomly assign cases to different treatment groups and then compare results on the response variable(s) |
| Matched pairs experiment | each case gets both treatments in random order, examine individual differences in the response variable between the two treatments. |
| Control group | Nothing is done to this group that might directly influence the response variable |
| Placebo effect | If people believe they are getting an effective treatment, they may experience the desired effect regardless of whether the treatment is any good |
| Single-blind experiment | participants are not told which group they are in |
| Double-blind experiment | participants and not told which group they are in and the people interacting with the participants/recording results do not know who is in each group |
| Frequency table | gives the counts in each category of a categorical variable |
| Proportion | a summary statistic out of 1 that helps describe the categorical variable (also called relative frequencies): Number in that category _________________________________ Total number |
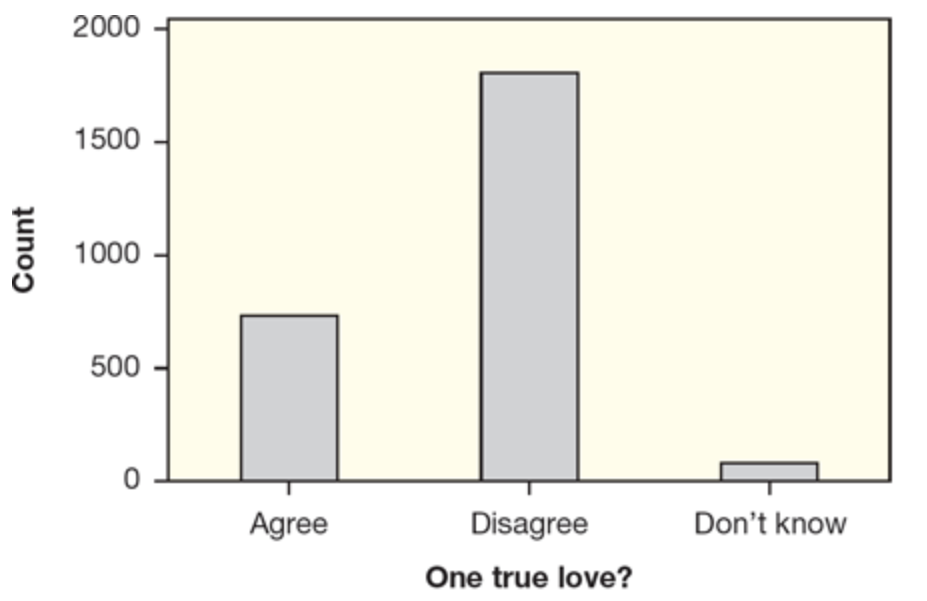
| What kind of chart is this? | Bar chart |
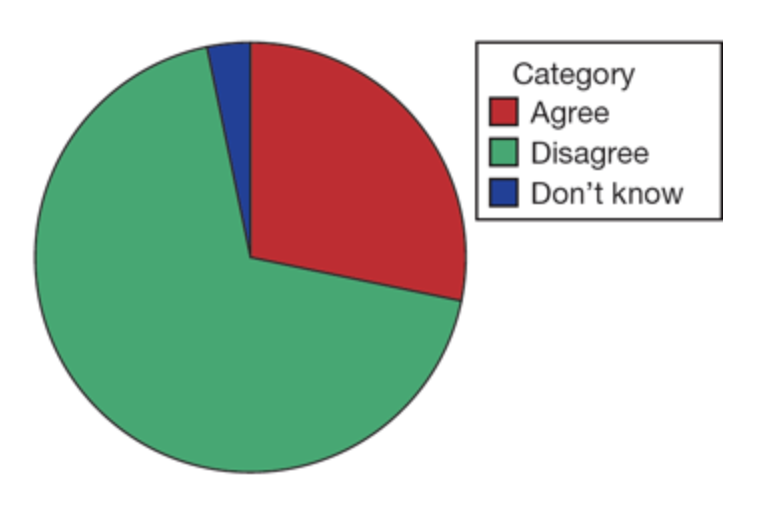
| What kind of chart is this? | Pie chart |
| Notation for Proportion | sample: p̂ ("p - hat") population: p |
| Two-Way Table | shows the relationship between two categorical variables. Categories for one variable are listed down the side (rows) and categories for the second are listed across the top (columns) |
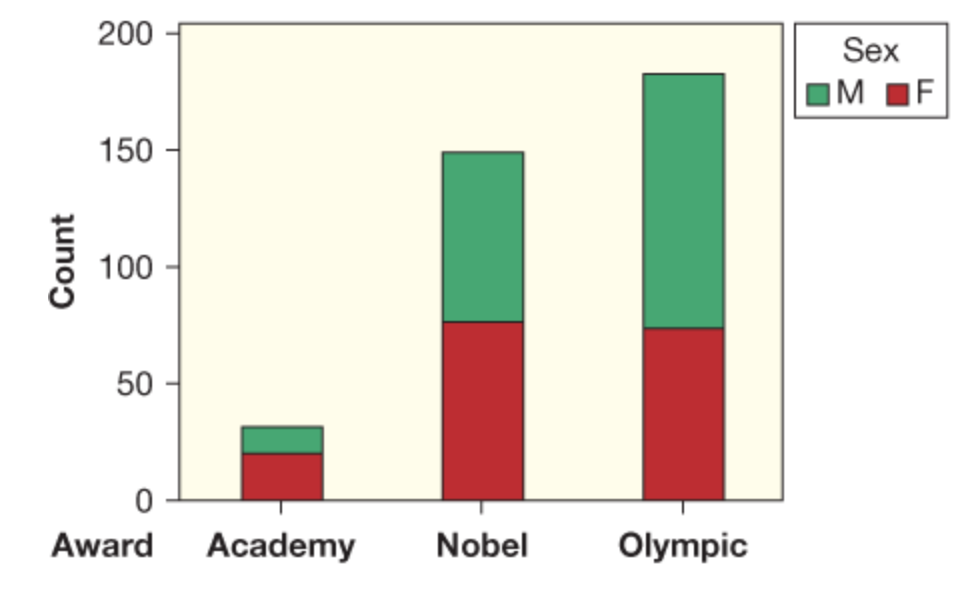
| What kind of chart is this? | A segmented bar chart |
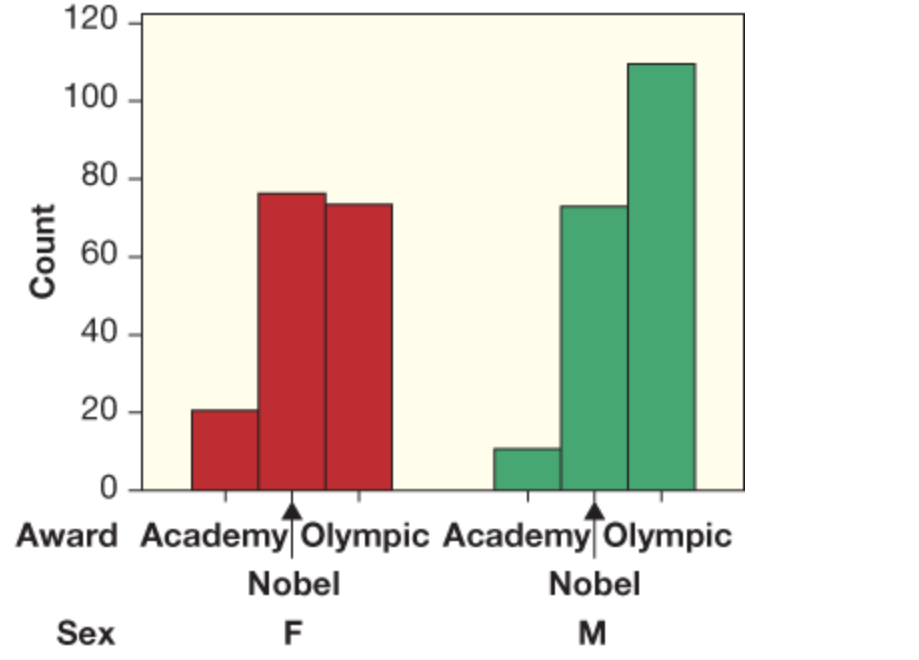
| What kind of chart is this? | Side-by-side bar charts |
| Comparative plots | Graphs that allow us to compare groups in a categorical variable ex: segmented bar chart, side-by-side bar chart |
| What three questions do we consider when describing a single quantitative variable? | 1. What is the general shape of the data? 2. Where are the data values centered? 3. How do the data vary? |
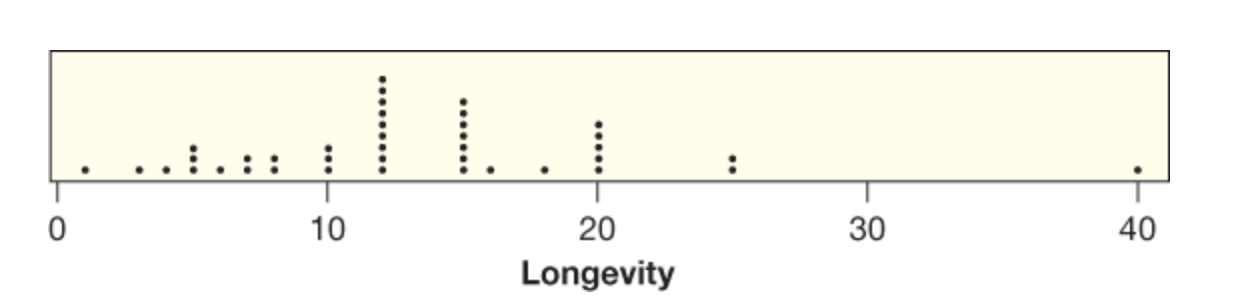
| What is this? | A dotplot |
| Outlier | an observed value that is notably distinct from the other values in a dataset. Usually much larger or smaller than the rest. |
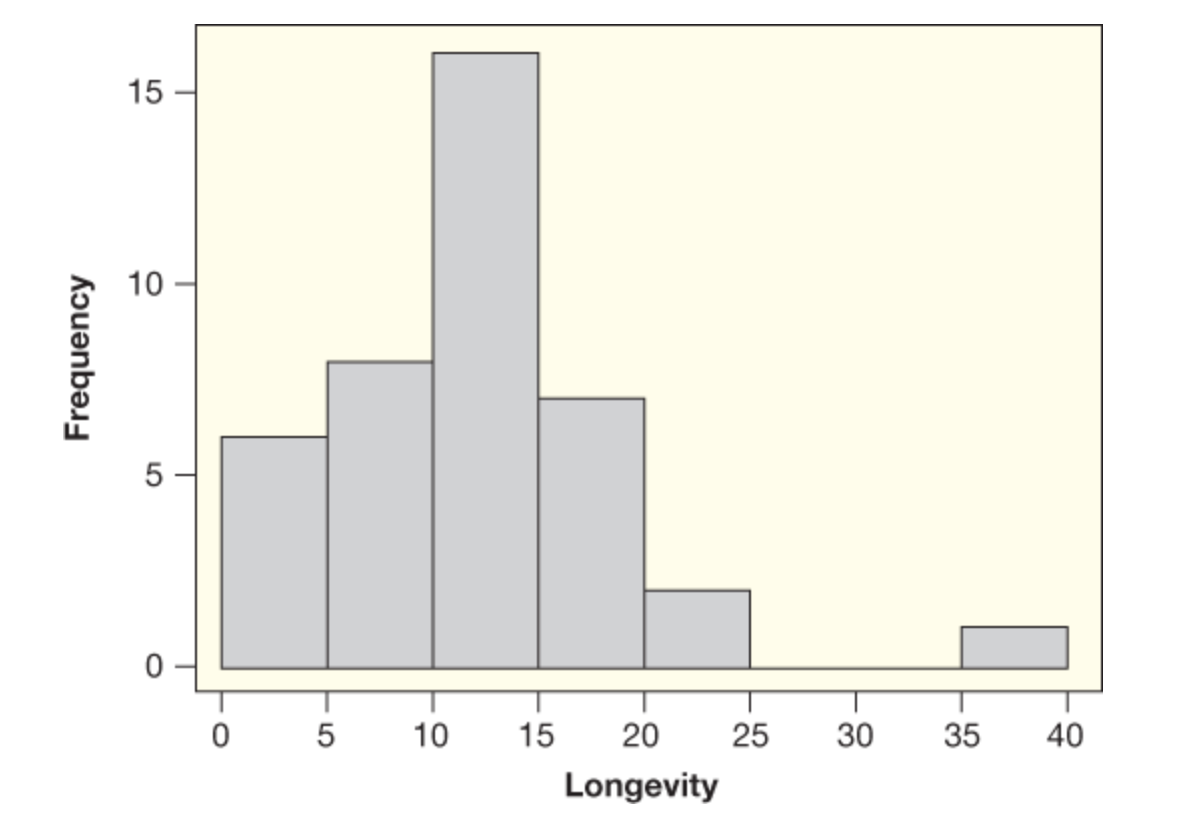
| What type of graph is this? | A histogram |
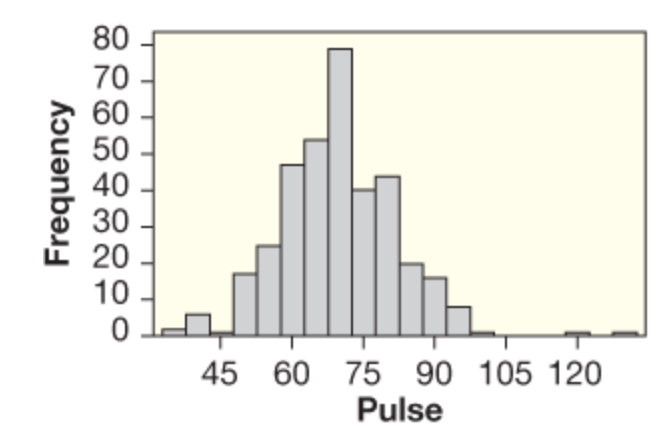
| Symmetric distribution | we can fold the plot over a vertical center line and the two sides match closely |
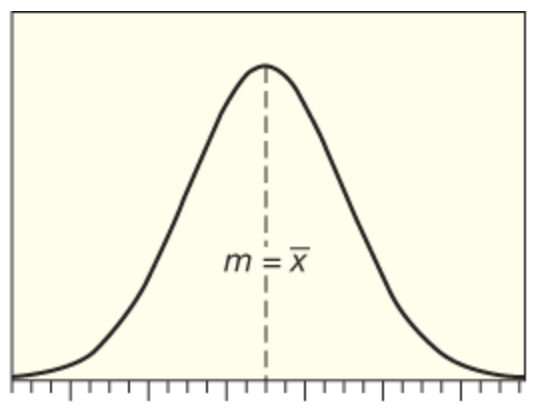
| How would you describe this histogram's distribution? | Symmetric & bell-shaped |
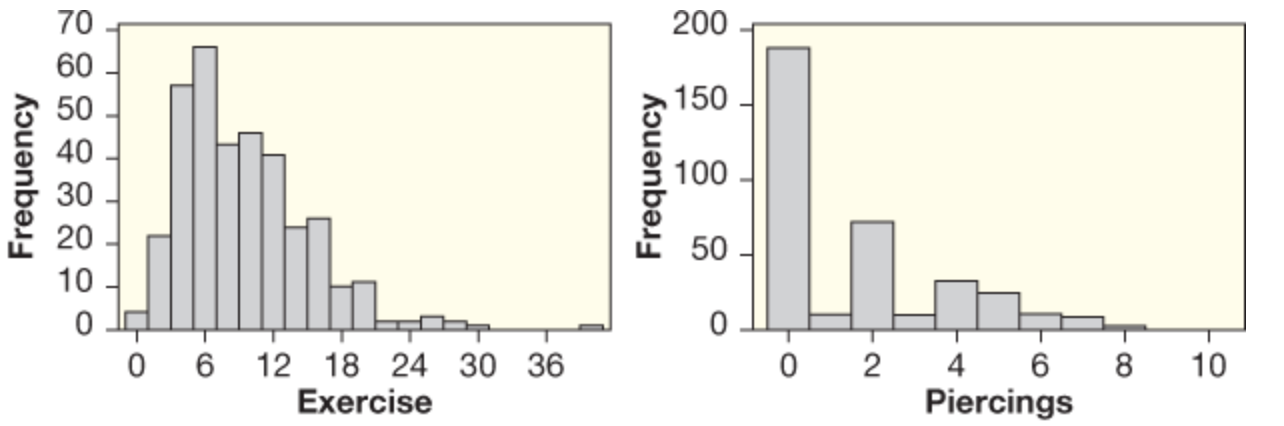
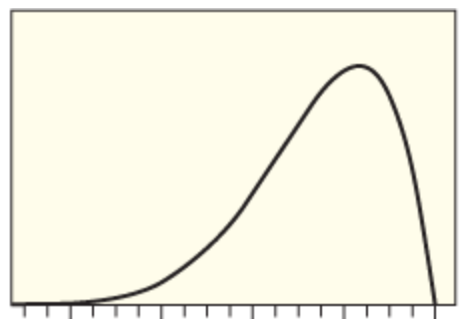
| How would you describe these histograms' distribution? | Skewed to the right |
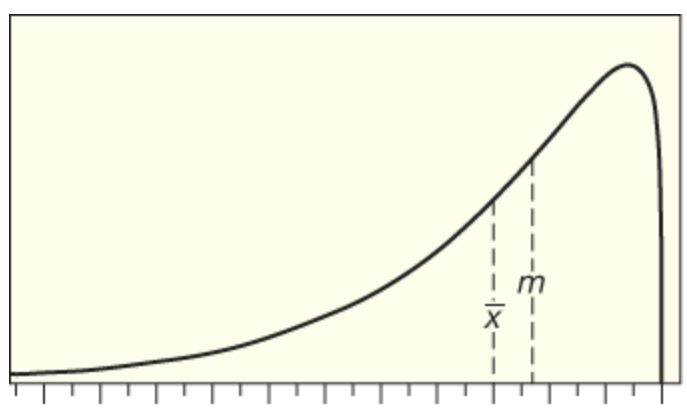
| How would you describe this distribution? | Skewed to the left |
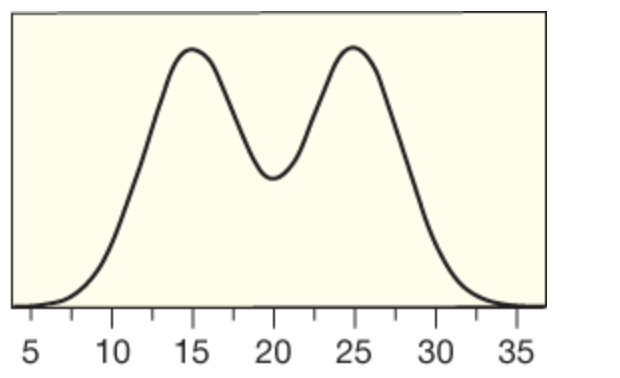
| How would you describe this distribution? | Symmetric but not bell-shaped |
| Mean | Sum of values divided by number of values Σx _____ n |
| Notation for mean sample / population | sample: x̄ ("x-bar") population: μ (mu) |
| Median | (splits the data in half) - the middle entry if an ordered list has odd # of entries -the average of the middle two values if an ordered list has an even # of entries |
| Resistance | a statistic is resistant if it is relatively unaffected by extreme values - the median is resistant, while the mean is not |
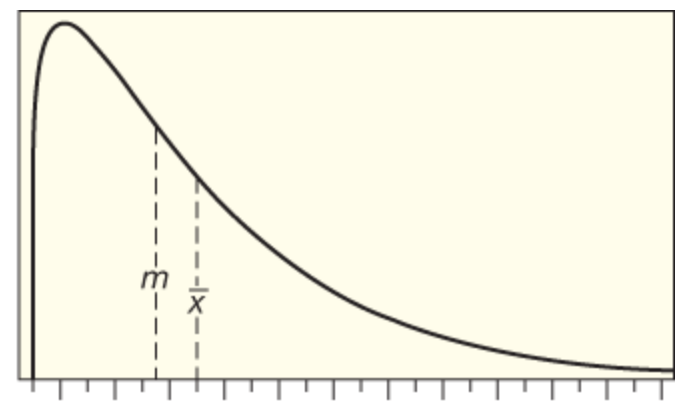
| Is Mean <, >, or = to Median? | Mean < Median |
| Is Mean <, >, or = to Median? | Mean = Median |
| Is Mean <, >, or = to Median? | Mean > Median |
| Standard deviation | A statistic that measures how much variability there is in the data - how much spread there is in a sample |
| Standard Deviation notation sample population | sample = s population = σ |
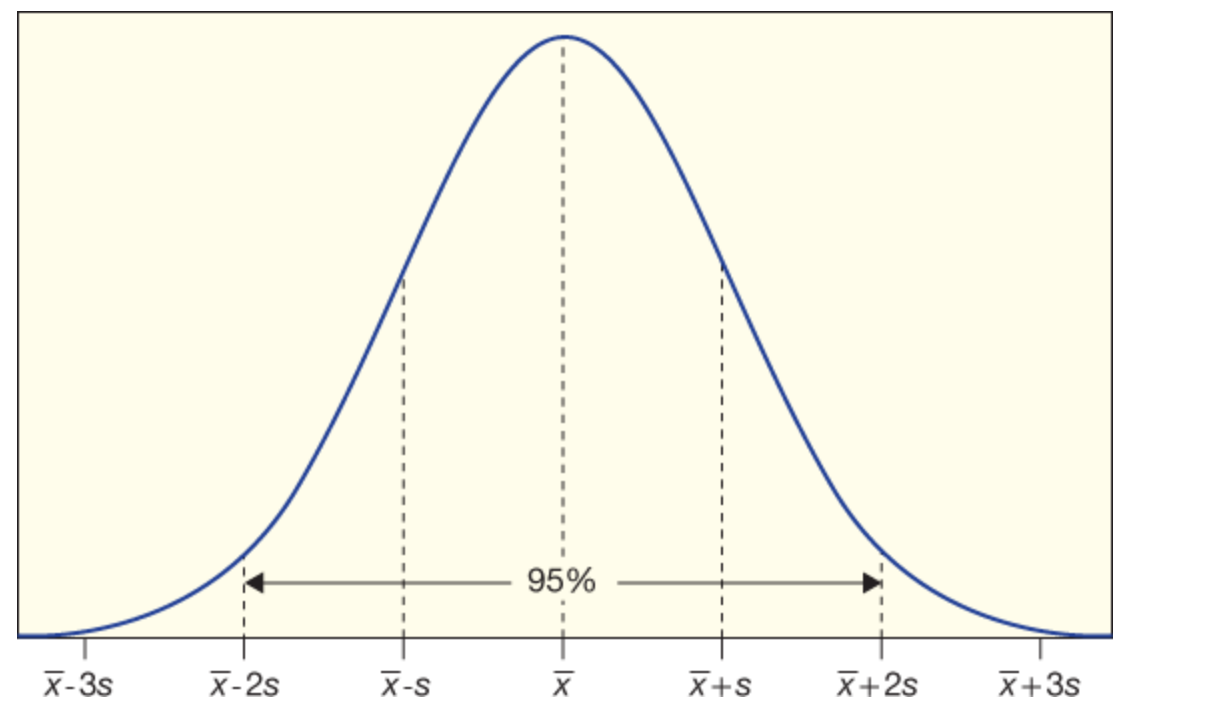
| The 95% Rule | If data is approximately symmetric & bell-shaped, about 95% of the data should fall within two standard deviations of the mean. |
| Z-score | how many standard deviations the value is from the mean x - x̄ ___________ s |
| P(th) Percentile | the value of a quantitative variable which is greater than P percent of the data |
| Five Number Summary | min, Q1, median, Q3, max |
| Range | Max - min |
| Interquartile range (IQR) | Q3 - Q1 |
| Choosing measures of center & spread | Mean & Standard Deviation: -Use all data values -Not resistant to outliers Five Number Summary: -if there are outliers / heavily skewed data, FNS can provide more info |
| boxplot | - A numerical scale appropriate for values - A box stretching from Q1 to Q3 -A line that divides the box at the median -A line from each quartile to most extreme non-outlier -Each outlier plotted individually |
| IQR method for detecting outliers | A) Smaller than Q1 - 1.5(IQR) B) Larger than Q3 + 1.5(IQR) |
Want to create your own Flashcards for free with GoConqr? Learn more.