4124785
Description
Flashcards by Danielle Weir, updated more than 1 year ago
|
|
Created by Danielle Weir
about 10 years ago
|
|
| Question | Answer |
| Principles of Data Reduction (9) | 1. Headings 2. Comparison elements in columns (not rows) 3. Labelling 4. Gridlines and Gaps 5. Summary figures: averages and totals 6. Ordering: sort by decreasing brand size 7. Brands in rows 8. round to 1-3 significant figures 9. Display relevant units (% or $) and scales ($0,000) 10. Give brief written summary 11. Include a title 12. Alignment (usually to right) |
| Market Share (%) | definition: percentage of total brands sales in a market calculation: (brand purchase total / category purchase total) x 100 |
| Penetration (%) | definition: proportion of shoppers who are buyers calculation: (brand buyers / shoppers) x 100 |
| Purchase Frequency (times) | definition: Purchase rate relative to the buyers of a brand calculation: brand purchase total/brand buyers |
| Purchase Rate (times) | definition: the purchase rate relative to the shoppers of the category calculation: brand purchase total/shoppers |
| Share of Category Requirements (SCR%) | def: The proportion allocated to a brand of the purchases made in the category by the buyers of same calculation: (brand purchase total/total accumulative category purchases by buyers of that brand) x 100 |
| 100% Sole Loyalty | definition: The proportion of buyers who buy only the brand calculation: (YES/Buyers) x 100 (If buyer of brand is loyal count yes) |
| What are the brand size measures? | Market Share and Penetration |
| What are the brand loyalty measures? | Purchase Frequency Purchase Rate Share of Cat Req. 100% Loyalty |
| What are 2 patterns we see within BPM's? | Double Jeopardy and Duplication of Purchase Laws |
| Double Jeopardy | • Small brands have fewer buyers who purchase less often • Big brands have more buyers who purchase more often |
| Duplication of Purchase Law | • Small brands ALWAYS share their buyers with big brands • Big brands SOMETIMES share their buyers with small brands • Brands share their buyers with other brands in line with their market shares |
| What is the purpose of the Dirichlet Model? | The Dirichlet is an empirical generalisation that explains 'how people buy' and 'how brands compete and perform' in the market |
| What tasks is the Dirichlet used for? | Forecasting tool to develop marketing strategies and assess the effectiveness of current marketing practices (e.g. promotion, distribution) Analysis of market trends and BPM's |
| How do people buy? (4) | 1. INFREQUENTLY - non and light buyers 2. RANDOMLY - buy regardless of previous purchases (zero-order) 3. REPERTOIRE - multi-brand buying 4. HETEROGENEITY - people are different in their preferences |
| Dirichlet models fit when? | 1. Deviations are small (+/- 10% relative to average observed values of BPM) 2. The Mean Absolute Deviation (MAD) is small 3. There are no obvious patterns in the data |
| How brands compete and perform? (4) | 1. Double Jeopardy 2. DoP Law 3. Repertoire buying - No Partitioning 4. New or light buyers are important (Penetration over PF) |
| Purpose (Applications) of Polarisation (3) | 1. Comparing a brand against the rest of the category 2. Comparing a small brand against a big brand 3. Evaluating the effectiveness of loyalty programs |
| Advantages of Polarisation | Standardised measure of brand loyalty without the effects of brand size - enables benchmarking |
| Types of loyalty (2) | Attitude: Consumer preferences e.g. I like coke WEAKER FORM - not directly captured in BPM's - less relevant Behaviour: Measured by looking at actual purchases made by consumers over a given period of time - enhances predictability - directly affects brand performance |
| Polarisation index formula 0:1 | (repeat rate - market share) / (1 - market share) 0= pure heterogeneity, no loyalty 1= maximum homogeneity, extreme loyalty |
| Conditional Trend Analysis (purpose) | -Predict future purchasing behaviour of customers of a brand -Identify the source of sales growth or decline of a brand -Explain the impact of marketing activities on non, light, medium, and heavy buyers |
| random nature in period-by-period purchasing | in period-by-period purchasing, it is normal that non and light buyers increase their purchases, while heavy buyers decrease their purchases. |
| Implications for marketers | 1. Theoretical benchmark for future sales based on past performance 2. Helps in marketing planning activities 3. Tracking of brand performance |
| CTA FORMULA | S2|x = (x+1) * B(x+1) Predicted sales in Period 2, conditional on the shoppers who made (x) purchases in period 1. Where B(x+1) is the predicted number of shoppers who made (x+1) purchases in period 1from the NBD model. |
| Best-Worst formula tasks | -Need to understand and predict consumer preference -Need to rank importance of one attribute to another -preferred attributes by consumers -identify consumer segments for product attributes |
| Methods to measure consumer preference RATING METHOD | Rating method 1: not imp 10: ext imp advantages: simple, easy to present, not costly disadvantage: questionable data quality |
| Methods to measure consumer preference RANKING METHOD | Ranking method Most important to least important (numbers do not reoccur) advantages: most appropriate method for conceptual mapping of values disadvantages: difficult for respondents, complex, time-consuming, costly |
| Methods to measure consumer preference CONSTANT SUM | CONSTANT SUM divide 100 points between attributes advantages: Able to capture small differences in consumer preferences disadvantages: Complex when the number of attributes is too high |
| Methods to measure consumer preference Method of Paired Comparison | METHOD OF PAIRED COMPARISON Compare between 2 attributes at one time advantages: good information on the reliability of a respondent’s choices disadvantages: requires many comparisons |
| BEST-WORST METHOD | tick which is most important (best) and which is least important (worst) |
| Underlying theory and advantages | random utility theory Easy to conduct and interpret Good for comparative research (i.e. segmentation techniques can be applied to the data) Provides reliable information for respondent choices High forecasting ability |
| Best Worst Formula | Count (best) - Count (worst) / frequency*# of respondents |
| Conjoint Analysis definition | Conjoint analysis is a method that determines how consumers value different attributes/attribute levels that make up products and services |
| Conjoint Analysis Marketing Tasks | -design new products to enhance consumer value -predicting market share of a new launch -identifying market segments -measure consumer preference for a product attribute -identifying combination of attribute levels of product attributes that has the highest choice probability |
| Conjoint Analysis Purpose | Using data from fieldwork (discrete choice experiments) to determine the feasibility of product attributes, and consumers' choice probability (or likelihood) of product attribute combinations. |
| Conjoint Analysis Applications | -Calculating dollar values for attributes -Calculating predictive market shares -predicting purchase intentions |
| Conjoint Analysis dollar value formula | change in price/absolute b value |
| Bass Model Purpose | used in forecasting adoption of new products -attempts to predict how many customers will adopt the new product and when they will adopt |
| Bass Model implications | 1. Forecasting new product adoption 2. Decision-making about viability of new products (particularly durable products and technology) 3. Thinking of new product performance |
| Bass Model Assumptions (8) | 1. The market potential N remains constant. 2. The customer decision is binary e.g. either the adopt or not adopt. 3. Uniform mixing e.g. everyone can come into contact with everyone else. 4. No repeat or replacement purchase of the innovation. 5. Marketing strategies supporting the innovation do not influence adoption. 6. The value of q is fixed throughout the lifecycle of the innovation. 7. Imitation always has a positive impact- no negative word of mouth. 8. Sales of an innovation are considered to be independent of the adoption/or non adoption of other innovations. |
| Bass Model Coefficients | q: the coefficient of imitation (internal influence word of mouth) p: the coefficient of innovation (external influence knowledge/advertising) q>p = Imitation dominates innovation (slow growth) p>q = Innovation dominates imitation (instant hit) |
| Bass Model Parameters | N : Total number of potential buyers of new product (constant) n(t) : Number of new adoptions at exactly time (t). N(t) : Cumulative adoptions of the product up to time (t). |
| ADBUDG Response Functions Purpose | Identify the effects (relationship or correlations) between two or more elements of comparison, such as -effects of marketing activities: advertising costs, promotion spend -product performance: sales performance, market share, profit |
| Linear Response Model | Y = a+bX Dependent variable Y = sales level Independent variable X = actions of marketing a = y-intercept b = coefficient that defines increase/decrease and strength of increase/decrease |
| Pros and Cons of Linear Response Model | Pros: -easy to understand -interpolation -given market data, can use standard regression methods to estimate parameters Cons: -unrealistic - no upper bound on Y -extrapolation -gives managers unrealistic guidance on decisions because it creates a false impression that sales continue to increase as advertising increases |
| ADBUDG response function | shows relationship between advertising and sales -estimates optimum level of advertising Y = sales X = advertising a = maximum boundary for sales values b = minimum boundary for sales values c = determines shape of the curve d = affects the slope/angle of the graph function |
| ADBUDG response function s-shape/concave | c > 1 = s-shape c < 1 = concave shape |
| Price elasticity definition | Measure of the responsiveness of a change in demand for a good or service to a change in its price. |
| Price elasticity tasks | -How much to increase price to cover production cost increase -How much to reduce price to maintain market share when competitors lower prices? |
| Price and demands PE values | PE = 1 Demand rises by same percentage that price falls PE > 1 Demand rises by more than price falls (gold price) PE < 1 Demand rises by less than price falls |
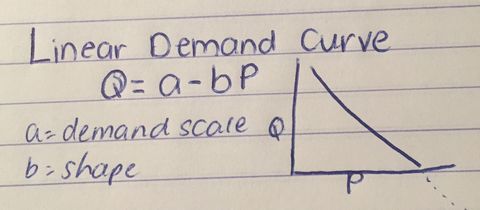
| Demand Curves variables | Independent variable (P) Marketing actions that the marketer can control (e.g. price, advertising) Dependent variable (Q) The measure used for monitoring and evaluating marketing actions (e.g. sales quantity or demand) |
| Price Elasticity formula | PE = (Q1-Q0)/Q0)/(P1-P0)/P0) |
| Demand Curves Linear Demand Curve | pros: simple cons: does not reflect what we expect, with extrapolation to higher prices it generates unrealistic demand (negative demand for high price) |
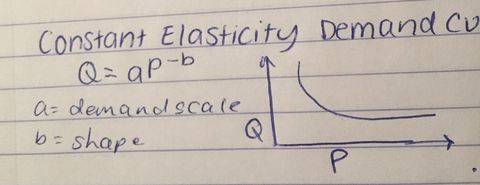
| Demand Curve Constant Elasticity Demand Curve | pros: better reflects what we expect, with extrapolation to higher prices it generates more realistic results cons: with extrapolation to lower prices it generates unrealistic results (for low prices it estimates very high demand) |
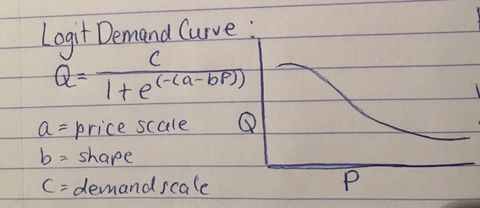
| Demand Curve Legit Demand Curve | pros: better reflects what we expects, generates more realistic results when extrapolating to either higher or lower prices Cons: complicated |
Want to create your own Flashcards for free with GoConqr? Learn more.