442163
Description
Flashcards by Steve Hiscock, updated more than 1 year ago
|
|
Created by Steve Hiscock
almost 12 years ago
|
|
| Question | Answer |
| Heteroscedastic | Fans out around the linear. Increasing variance with Y axis for example |
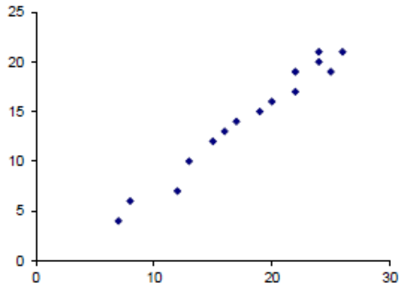
| Strong, linear, positive relationship (y increases as x increases). Linear because we could imagine a straight line passing through the points | |
|
Image:
Scat_Weak_Linear (image/png)
|
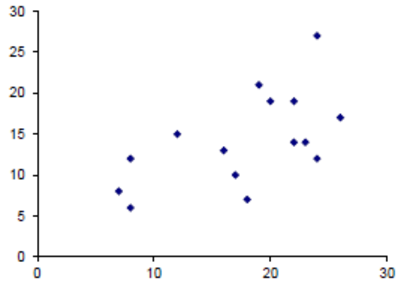
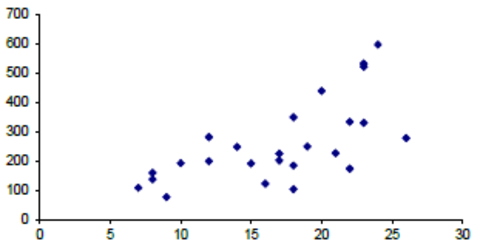
Weak, linear, positive relationship (y tends to increases with x ) |
| Weak, linear, negative relationship (y tends to decrease with x ) | |
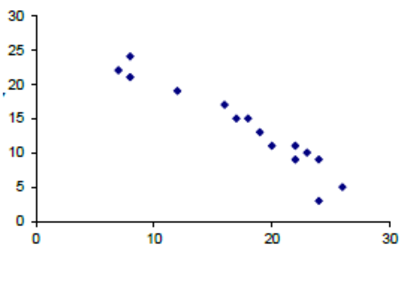
| Strong, linear, negative relationship (y decreases with x ) | |
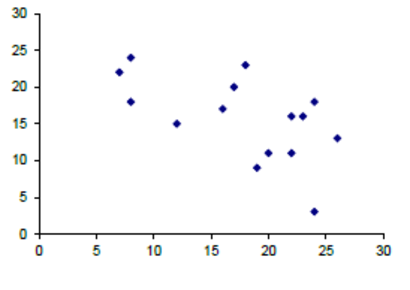
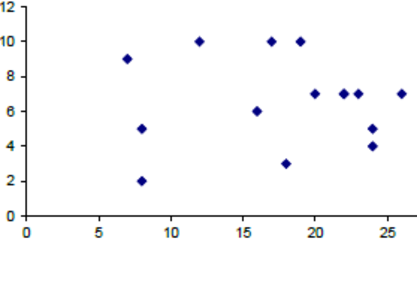
| Little or No relationship | |
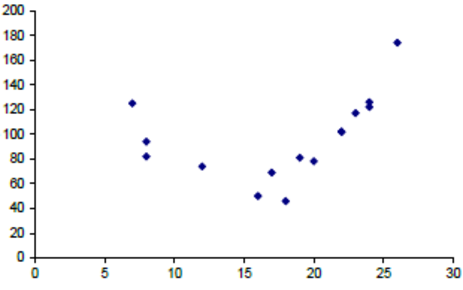
| Strong relationship, but non-linear, possibly quadratic. | |
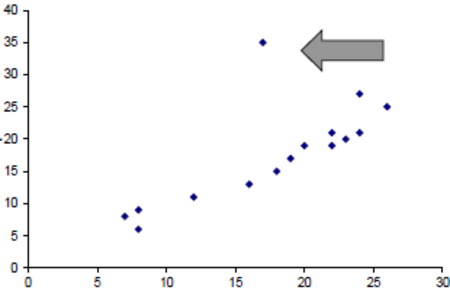
| Strong linear positive relationship, but with an obvious unusual point known as an outlier. Little variance (Heteroscedastic) | |
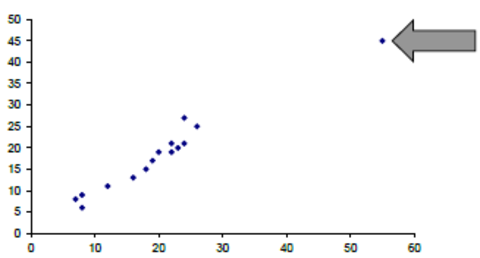
| Strong linear positive with Outliner on line of best fit (Influential point) | |
| Some sort of linear relationship as Y tends to increase with X, but the variation in Y increases with x, giving a fan out effect | |
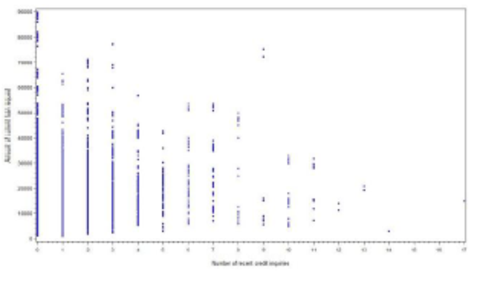
| Variance of Y decreases with X (Heteroscadastic). X is rounded or discrete. A few outliers are present. Possibly has a downward trend |
Want to create your own Flashcards for free with GoConqr? Learn more.