
Flashcards
PreAlgebra End of Year Review
Cards in this deck (53)
- 1Solve 2(-8 - 3x) + 5 = -53x = 7
- 2How many solutions does the equation -9x + 10 = 12 - 9x have?None
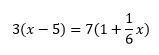
- 3Solve

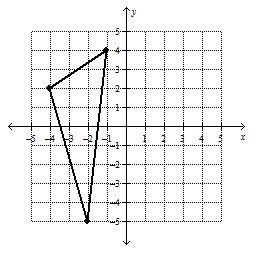
- 4Draw a reflection of the figure in the y-axis.
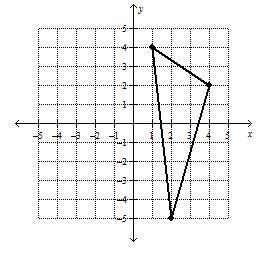
- 5Rotate the figure 90° counterclockwise about the origin.
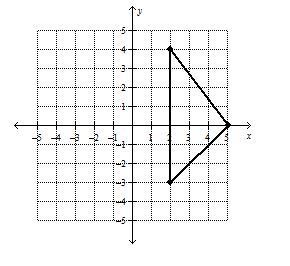
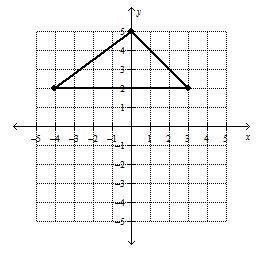
- 6Translate the figure 5 units right and 3 units up.
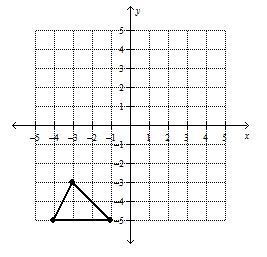
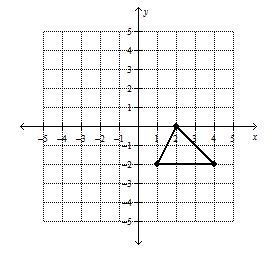
- 7A square is reflected, rotated, and translated. Is the new image congruent to the original?Yes - reflected, rotated, and translated images are always CONGRUENT. Congruent means that all corresponding side lengths and angles are EQUAL.
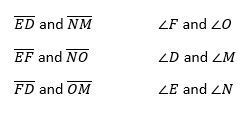
- 8Identify the corresponding parts.
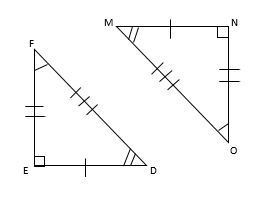
- 9In the figure,∆ABC is congruent to ∆XYZ. Write a sequence of transformations in which ∆XYZ is the image of ∆ABC.Reflection over the y-axis and then translate 8 down and 5 right
OR
Translate 8 up and 5 left and then reflect over the y-axis.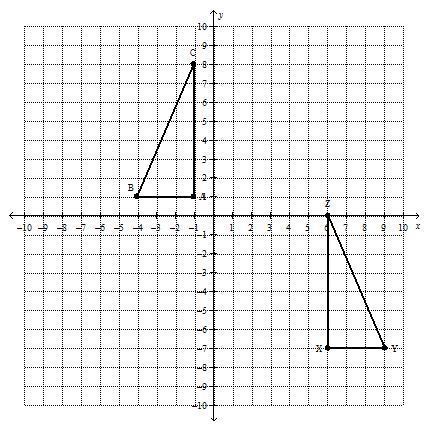
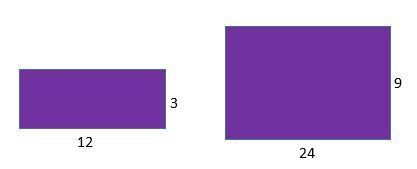
- 10Are the two figures similar?No - side ratios are not equal.
- 11In the figure, ∆ABC is similar to ∆DEF. Write a sequence of transformations in which ∆DEF is the image of ∆ABC.A dilation with respect to the origin using a scale factor of 2 followed by a reflection in the y-axis
OR
A reflection in the y-axis followed by a dilation with respect to the origin using a scale factor of 2.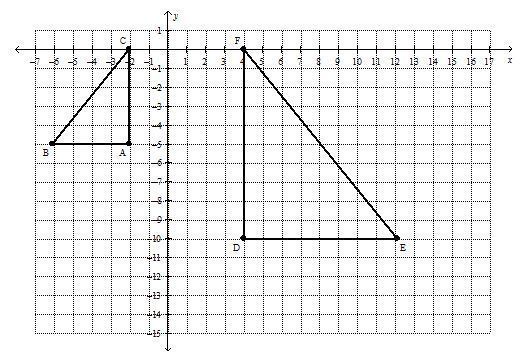
- 12Find the value of x.x = 125°
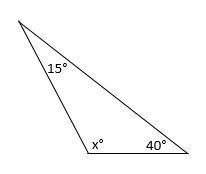
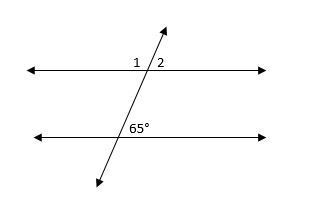
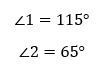
- 13Find the measures of ∠1 and ∠2.
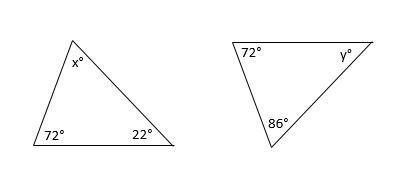
- 14Tell whether the triangles are similar.YES - all 3 angles are equal.
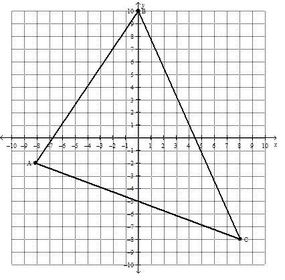
- 15The vertices of a triangle are A(-4, -1), B(0, 5), and C(4, -4). Draw its image after a dilation with respect to the origin using a scale factor of 2.
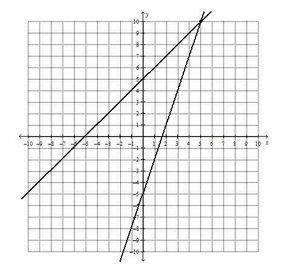
- 16Plot the solution of the system. y = x + 5 y = 3x - 5(5, 10)
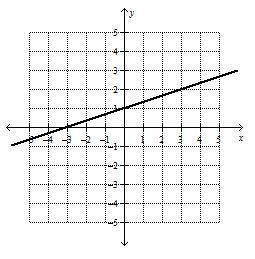
- 17Find the slope of the line.1/3
- 18Write in slope-intercept form an equation of the line that passes through the points (-1, 3) and (1, -11).y = -7x - 4
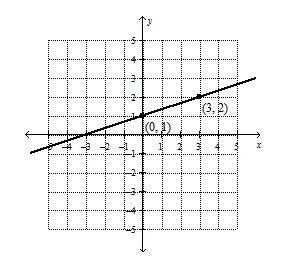
- 19Write an equation of the line in slope-intercept form.y = 1/3x + 1
- 20Graph y = 3x - 4
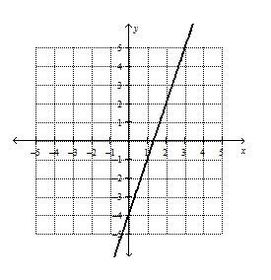
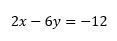
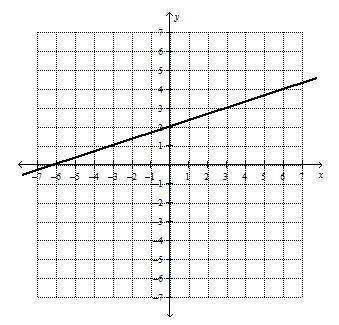
- 21Graph
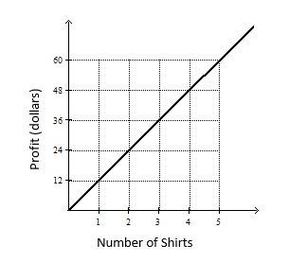
- 22The profit y (in dollars) for a company for selling x shirts is represented by y = 12x. Graph the equation. Is this relationship a direct variation?Yes, this is a Direct Variation - Linear with (0, 0)
- 23The graph shows the number of helmets purchased and the total cost. What is the cost per helmet?$13 per helmet
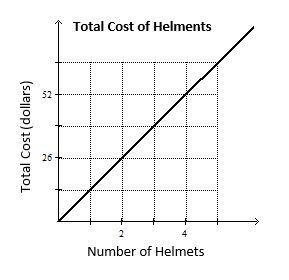
- 24The distance Bus A travels is y = 75x. The graph shows the distance Bus B travels. Which bus is traveling faster?Bus A
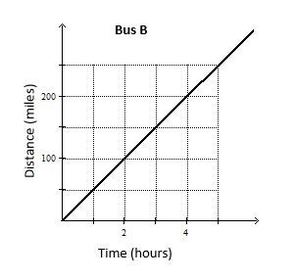
- 25The total cost at Arcade A is y = 0.50x + 4. The table shows the total cost at Arcade B. Which has the higher entrance fee? Which has the higher fee per game?Arcade B has the higher entrance fee. Arcade B also has the higher fee per game.

- 26Which table is linear?Table A
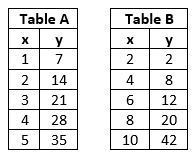
- 27Which graph is linear?Both Graphs are linear.
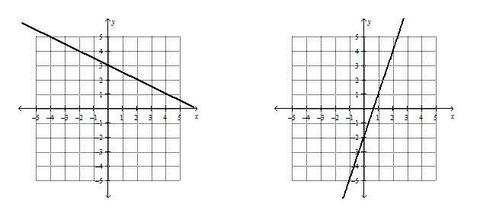
- 28The equation y = 30x + 200 represents the total money y (in dollars) that Kate has in her savings account after x months of saving. What is the slope? What does the slope mean? What is the y-intercept? What does the y-intercept represent?Slope is 30. This means Kate is saving $30 each month.
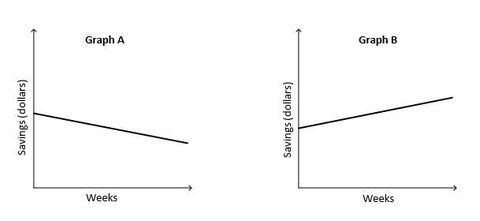
The y-intercept is 200. This represents the amount of money Kate had when she started saving. - 29Which graph represents a constant increase? Which graph represents a constant decrease?Graph B shows a constant increase. Graph A shows a constant decrease.
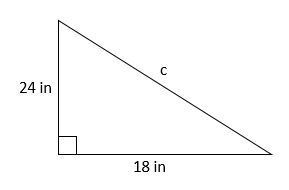
- 30Find the length of the hypotenuse.30 in
- 31Find the distance between (5, -3) and (12, 2). Round your answer to the nearest tenth.8.6
- 32Tell whether the triangles with the given side lengths is a right triangle. 6 in, 8 in, 10 inYES because 36 + 64 = 100
- 33Find the volume of the cone. Round to the nearest tenth.
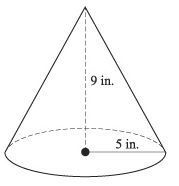

- 34Find the volume of the cylinder. Round your answer to the nearest tenth.
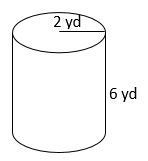

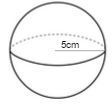
- 35Find the volume of the sphere. Round your answer to the nearest tenth.

- 36Find the square root. Write your answer as a fraction.


- 37Find the cube root. Write your answer as a fraction.


- 38Is this a rational number or an irrational number?Irrational Number

- 39Write this decimal as a fraction in simplest form.


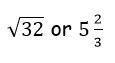
- 40Which is greater?

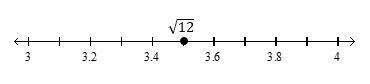
- 41Plot the approximate value of this number.

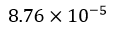
- 42Write 0.0000876 in scientific notation.
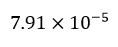
- 43Write the following number in standard form:0.0000791
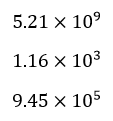
- 44Which number has the greatest value?
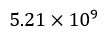
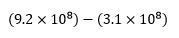
- 45Find the difference. Give your answer in Scientific Notation.

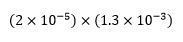
- 46Find the product. Give your answer in Scientific Notation.

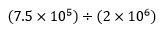
- 47Find the quotient. Give your answer in Scientific Notation.

- 48A calculator display shows the number 4.2E9. Write this number in standard form.4,200,000,000
- 49Evaluate248

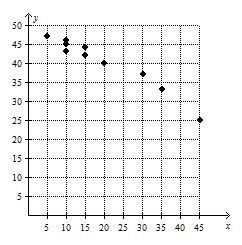
- 50Make a scatter plot for the data. What type of relationship does the data show?The scatter plot shows a negative linear relationship.

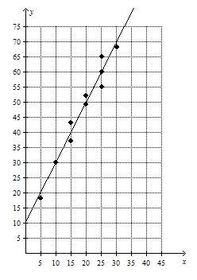
- 51Draw a line of fit using (10, 30) and (25, 60). Write an equation for the line of fit. Predict the value of y when the value of x is 60.The equation is y=2x+10.
When x=60, y=130.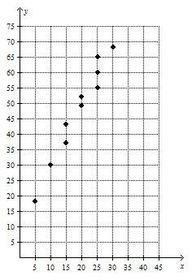
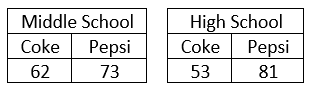
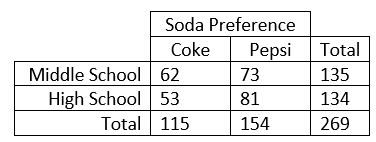
- 52Results from a survey are shown below. Complete a two-way table that includes the marginal frequencies.
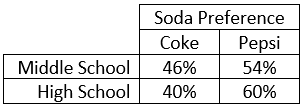
- 53Find the percent of middle school and high school students that prefer each soda.
Information
- Description
- Questions to prepare for the End of Year Final Test in PreAlgebra.
- Created by
- Karla Digmann
- Views
- 1,720
- Tags
- Rating