
Flashcards
BISC 100: Lecture 31, 32, 33, 34 :Ecology
Cards in this deck (90)
- 1ECOLOGYScientific studies of the interactions
that determine the distribution and abundance of
organisms - 23 WAYS TO LOOK AT ECOLOGY1.Levels and principles
2. Population Ecology
3. Conservation Biology - 3ECOLOGICAL LEVELSBiosphere
Biome
Ecosystem
Community
Population
Individual - 4BIOSPHEREDefinition: That portion of the earth where all living
organisms reside
- Total of all of Earth’s ecosystems - 5Abiotic factors of the biospherePatterns in the distribution of life mainly reflect differences
in the abiotic environmental factors
- Usable energy source, temperature, water, inorganic
nutrients
- Some additional factors
- aquatic ecosystems: dissolved oxygen levels, salinity,
currents, tides
- Terrestrial ecosystems: elevation, wind, storms, fire - 6BiomesA biome is
a major terrestrial or aquatic life zone,
characterized by
–vegetation type in terrestrial biomes or
–the salinity and physical environment in
aquatic biomes. - 7Freshwater biomes(cover <1% of Earth)
have <1% salt concentration, ~6% known
species include lakes, streams, rivers, and
wetlands used for drinking water, crop
irrigation, sanitation, industry. - 8Marine biomestypically have ~3% salt concentration
include oceans, intertidal zones, coral reefs,
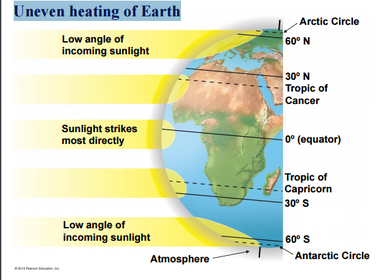
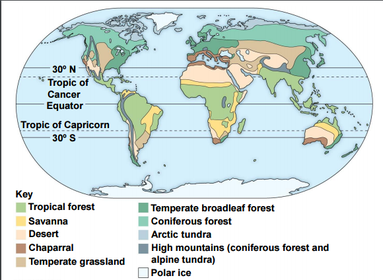
and estuaries. - 9How climate affects terrestrial biome distribution– Terrestrial biomes are primarily determined by
climate, especially temperature and rainfall.
– Earth’
s global climate patterns are largely the
result of
(i) radiant energy from the sun, and
(ii) Earth’s movement in space.
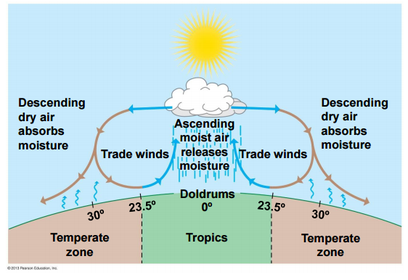
The descending dry air masses head into latitudes above
30°, and initially pick up moisture but later drop it as they
cool at higher latitudes. This creates the relatively wet
northern and southern temperate zones.
• Temperate zones generally have milder climates than the
tropics or the polar regions. They occur in latitudes
between the tropics and the Arctic Circle (north) and the
Antarctic Circle (south). - 10Uneven heating of Earth
- 11How climate affects terrestrial biome distributionHeated by the direct rays of the sun, air at the equator
rises, then cools (forming clouds), and drops rain.
– This largely explains why rain forests are concentrated
in the tropics, the region from the Tropic of Cancer to
the Tropic of Capricorn. - 12How uneven heating of Earth produces various climates
- 13—*
- 14ECOSYSTEMUnique communities of organisms that
interact with one another and their surrounding
environments in a given area - 15ECOSYSTEM COMPONENTSAbiotic resources
Abiotic conditions
Primary producers
Consumers
Decomposers - 16COMMUNITYUnique assemblage of populations
all the populations that inhabit a
specified area
collections of populations that have the ability to
interact with one another
key information:
1) number of species present
2) relative abundance of species
3) how different species contribute to community - 17DESCRIPTIVE PARAMETERS FOR COMMUNITIESDiversity
Stability
Trophic Structure - 18BIODIVERSITY: THREE TYPES
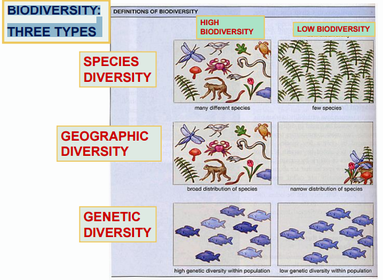
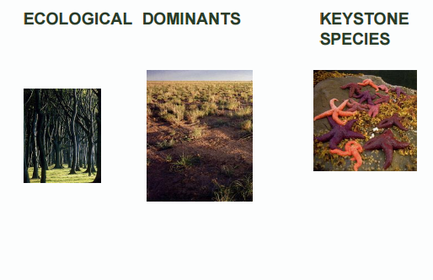
- 19ECOLOGICAL COMMUNITY
- 20STABILITYAbility to return to original
composition following perturbation - 21TROPHIC STRUCTUREFeeding relationships across the
different trophic levels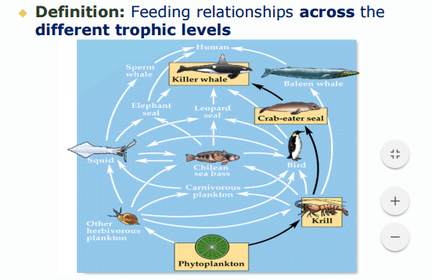
- 22What is a population?An interacting group of individuals of a particular
species that use common resources and are regulated by
the same natural phenomena.
Ecologists describe the number of individuals in a
population by the population size or by the population
density - 23Population Structure and DynamicsDensity and Dispersion
Density
Dispersion patterns - 24Density and Dispersionpatterns are important
population variables - 25DensityThe number of individuals per
unit area - 26Dispersion patternsHow individuals in a population are
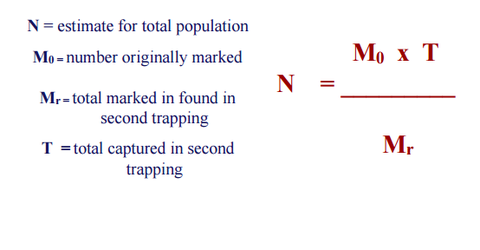
spaced within their areas - 27How to quantify a population?Mark and recapture: Used to
quantify mobile organisms.
ex. animals
Quadrat analysis:
Used for immobile organisms.
plants or sedentary animals - 28Mark and Recapture (formula)
- 29Dispersion patterns: CLUMPEDLocal aggregation in patches
- 30Clumped patterns usually result froma) an unequal distribution of resources
for plants and animals
b) Associations with mating and social
behavior of animals - 31Dispersion patterns: UNIFORMEven distribution over an area
- 32Dispersion patterns: RANDOMPattern less, unpredictable distribution.
Rare, ex. clams
distributed across a
sandy ocean bottom
Where the factors
affecting them are
numerous and
complexly interrelated - 33GROWTH OF A POPULATION Exponential increase:proportional to the number of
individuals that already exist - 34The Exponential Growth Model
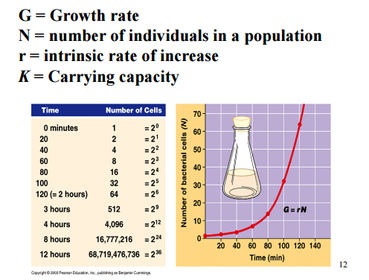
- 35The Logistic Growth ModelThis model takes limits to
population growth to
consideration
The rate of growth is
exponential in the
beginning, but is limited by
how close it is to the,
Carrying capacity (K):
maximum population size that
an environment can support.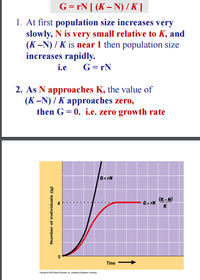
- 36POPULATION GROWTH CURVESExponential
Logistic
Complex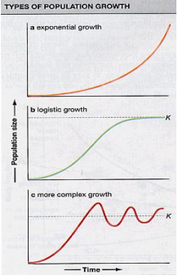
- 37POPULATION GROWTH IS LIMITED BY ENVIRONMENTAL RESISTANCE Density Dependent FactorsFOOD SHORTAGE
AVAILABILITY OF SUNLIGHT
TEMPERATURE CHANGES
INVASION BY PREDATORS OR PATHOGENS
WASTES BUILD UP TO TOXIC LEVELS
BREEDING SPACE
PHYSIOLOGICAL FACTORS
BOOM AND BUST
Complex pattern
Snowshoe hare and lynx:
Effects of biotic factors
predator-prey relationship
keeps growth of population
under check - 38POPULATION GROWTH IS LIMITED BY Density Independent FactorsEffects of abiotic factors
Climate, weather, floods, fires,
storms
Human activity
earth quakes
Tsunamis
Volcanic eruptions - 39SURVIVORSHIP CURVES
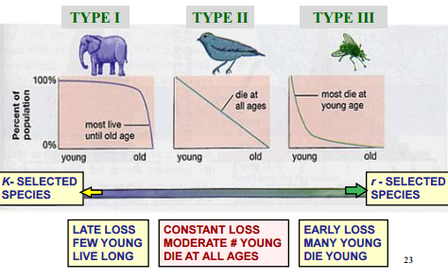
- 40GROWTH AND REPRODUCTIVE STRATEGIES
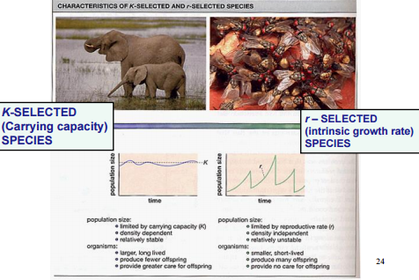
- 41Principles of population ecology have practical applications – Principles of population ecology are useful in managing natural resources Three such principles in practice are1. Harvesting crops without
damaging the resource.
2. Maximum sustained yield:
Harvesting is done at a level
that produces a consistent
yield without forcing
population to decline.
3. Integrated pest management:
Use a combination of
Biological, chemical and
cultural methods in
agriculture to control pests - 423 DETERMINANTS OF COMMUNITY STRUCTUREHistorical processes
• Resource utilization and tolerance
• Interspecific Interactions:
1. Competition
2. Predation
3. Symbiosis
PARASITISM (+, -)
MUTUALISM (+,+)
COMMENSALISM (+,0) - 43ECOLOGICAL NICHEIs the sum total of an organism’s use of biotic and
abiotic resources in its environment or in other words
how it “fits in to” an ecosystem
• A fundamental niche is the resources a population is
theoretically capable of using under IDEAL
circumstances.
• Biological constraints (competition, predation,
resource limitations) restrict organisms to their
realized niche - 44RESOURCE UTILIZATION AND TOLERANCENiche: ex. A barnacle’s niche:
Attachment sites on the intertidal rocks
Amount of exposure to air and sea water
Food it consumes
Only rarely does the realized niche of an
organism approximate its fundamental
niche: realized niche is always smaller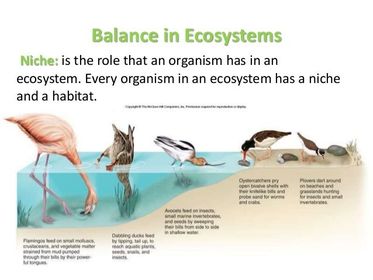
- 45Opportunistic Populationsrapid sexual maturity, produce
many offspring (quantity vs quality), little or no parental care,
short life span, high death rate, unpredictable climates, usually
one time reproduction, smaller off spring (or eggs) - 46Equilibrial populationsOpposite of all these traits:
rapid sexual maturity, produce
many offspring (quantity vs quality), little or no parental care,
short life span, high death rate, unpredictable climates, usually
one time reproduction, smaller off spring (or eggs) - 47APPLICATION OF POPULATION OF ECOLOGY1. Conservation of endangered species
2. Sustainable resource management
3. Studies on invasive species
4. Biological control of pests
5. Integrated pest management - 48Human Population DynamicsHuman population growth has started to
slow after centuries of exponential increase
• The human population
–Has been growing almost exponentially for
centuries, standing now at about 7.4 billion - 49Most Populous Cities of the World 2015
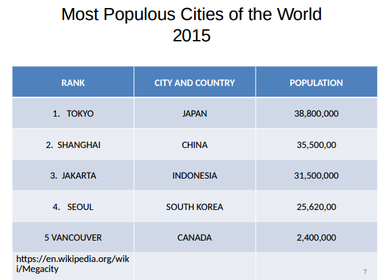
- 50What is demographic transition?• Is the shift from high birth rates and death
rates to low birth rates and death rates - 51What is the age structure of a population?It is the proportion of individuals in different
age-groups
• Affects its future growth - 52What is “Ecological Footprint” (EFP)?• An ecological footprint is the amount of land and water area
a person or a human population would need to provide the
resources required to sustainably support itself and to absorb
its wastes, given prevailing technology.
• The term was first introduced in 1996 by Canadian ecologists
William Rees and Mathis Wackernagel (a graduate student
working with Rees at the University of British Columbia at the
time).
• Footprinting is now widely used around the globe as an
indicator of environmental sustainability.
• It can be used to measure and manage the use of resources
throughout the economy. It is commonly used to explore the
sustainability of individual lifestyles, goods and services,
organisations, industry sectors, regions and nations. - 53The ecological capacity of the world may already be smaller thanthe population’s
ecological footprint - 54COMMUNITY INTERACTIONS 1. Competition1A. Competitive Exclusion
Two species of barnacles on intertidal rocKs
Interspecific competition prevents
species from occupying the same niche
1B: Resource Partioning
Habitat partitioning reduces competition:
Sympatric species show this type.
ex: Darwin’s finches: those who have different
sizes of beaks use same habitats.
It is also called Character Displacement
Allopartric species can not live in the same
habitats (requirements are mostly the same)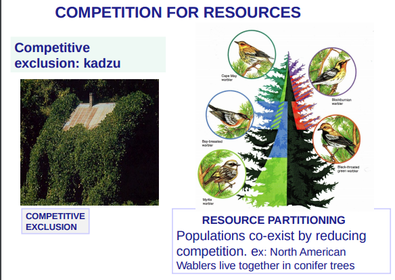
- 55COMMUNITY INTERACTIONS 2. PREDATIONDYNAMICS OF PREDATOR (wolf) AND
PREY (moose) POPULATIONS - 56Keystone SpeciesMany species in a community depend on ONE type of
organism, called Keystone species.
• Not the dominant producers
• These organism make up a small portion of the
community by weight, yet exerts a disproportionate
influence on community diversity.
• Many KS are versatile predators, that maintain
competition.
Ex. Seastars prey on diverse tide pool invertebrates
Birds eat herbivore insects
Mycorrhizal fungi influence composition of plant
communities - 57Effects of predation on communitiesKeystone predators help maintain diversity by
consuming, and reducing the density of prey
that are very strong competitors.
Ex: If sea star, Pisaster is removed, Mussels
(Mytilus) out competes many other shoreline
organisms.
Sea otters are keystone predators - 58DEFENSE MECHANISMS AGAINST PREDATORS PREY’S ADAPTATIONS TO AVOID PREDATION1. Size
2. Avoidance: Fleeing, Hiding (camouflage)
3. Mimicry (Batesian and Mullarian)
4. Defensive structures (Spines and armor)
5. Chemicals (in plants Strychnine, nicotine)
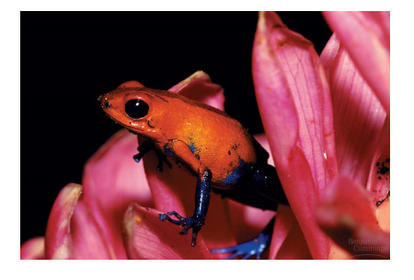
6. Chemicals in animals (poisonarrow frog) - 59Adaptation to avoid predation Camouflage
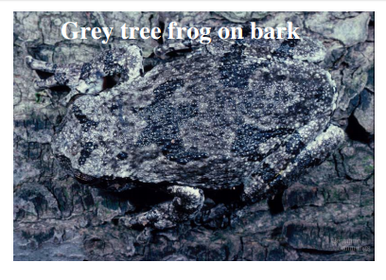
- 60Adaptation to avoid predation CHEMICAL DEFENSES: Poison arrow frog
- 61Mimicry• Is a “copycat” adaptation in which one species
mimics the appearance of another.
• Is used by some species to gain protection
– In Batesian mimicry (advertising mimicry),
• A palatable or harmless species mimics an
unpalatable or harmful model.
Ex. Viceroy butterfly & Monarch butterfly
Adaptation to avoid predation
Advertising mimicry : Batesian Mimicry
35
Hawk moth larva
(successful when in lower # s)
Looks like the distasteful and
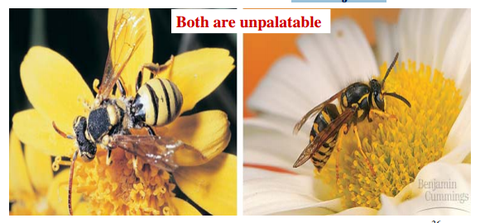
noxious Snake - 62Adaptation to avoid predation Deceptive mimicry: Mullarian mimicryCuckoo bee Yellow jacket
- 63Coevolution of Predator and PreyCoevolution: is a term that describes
longterm evolutionary adjustments
of species to one another.
Passiflora makes toxic substances
to protect its leaves from herbivores.
Heliconius catapillars can
breakdown the toxins therefore
can eat these leaves.
Plant also excrete yellow sugar
droplets which almost looks like the
eggs of the insect.
What evolutionary adaptive
mechanism works to prevent this herbivory? - 641. COMMENSALISMCATTLE EGRETS CATCH MORE
INSECTS WHEN THEY FORAGE
ALONGSIDE BUFFALOS
BUFFALOS ARE NOT HELPED OR
HARMED
Other examples for commmensalism
Epiphytic plants: Orchids, Bromeliads
Barnacles attached to large fish
Tropical fish and sea anemone - 652. MUTUALISMAnts and Bull’s horn Acacias
5
Ants of the species Pseudomyrmex
nests ONLY in the hollowed thorns of
an Acasia species.
They feed on the protein bodies
(Beltian bodies) and sugar droplets.
Ants provide protection to the plant
preventing herbivory. Ants not only
attacks the herbivores but also use
them as additional food.
Ants also help the plant compete with
other plants. - 663. PARASITISMEXTERNAL PARASITISM: ECTOPARASITES
A SPECIAL CASE OF PREDATION - 673B. INTERNAL PARASITISM: ENDOPARASITE 7 Extremely Specialized:Many protists and invertebrates that affect
humans. (Malaria parasite: Plasmodium)
The more closely the life of parasite is linked
with that of its host, the more morphology and
behavior are likely to have modified during the
course of its evolution. - 683C: Brood ParasitismCuckoos lay their eggs in nests
of other species of birds.
The host parent raise the brood
parasite as if they were one of
their own clutch.
In some species evolution has
fostered the hosts’
ability to detect parasite eggs and
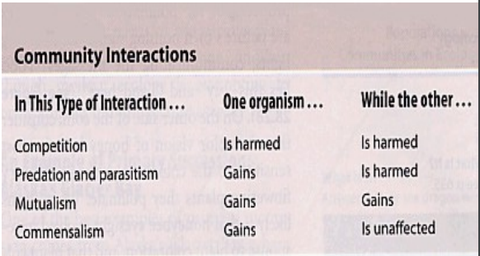
reject them. - 69SUMMARY OF COMMUNITY INTERACTIONS
- 70In short: Ecological successionis a transition in species
composition of a community
following a disturbance - 71Disturbance is a prominent feature of most communities – Disturbances are events thaTDamage biological communities,
remove organisms from them, and
alter the availability of resources
• Are characteristic of most communities - 72Primary successionPrimary succession occurs in an area
where no community previously existed.
Is the gradual colonization of barren
rocks - 73Secondary succession• Occurs after a disturbance has destroyed
a community but left the soil intact
• Replacing a disturbed community
Communities can recover from some forms
of natural and human caused
disturbances.
Depending on the community, the time
required for recovery varies from decades
to centuries. - 74– Energy flow and chemical cyclingDepend on the transfer of substances in the feeding
relationships, or trophic structure, of an ecosystem. - 75Trophic relationshipsDetermine an ecosystem’s routes of energy flow and
chemical cycling. - 76Trophic levelsDivide the species of an ecosystem based on their main
sources of nutrition. - 77Energy flow• Is the passage of energy through the
components of the ecosystem.
• Flows through an ecosystem when consumers
feed on producers.
• Cannot be recycled within an ecosystem, but
must flow through continuously. - 78–Chemical cycling• Is the use and reuse of chemical elements
within the ecosystem - 79Trophic structure is a key factor in community dynamicsEvery community has a trophic structure
• A pattern of feeding relationships consisting
of several different levels
– Trophic structures can be represented by food
chains
• The stepwise flow of energy and nutrients
from plants (producers), to herbivores (primary
consumers), to carnivores (secondary and
higherlevel consumers)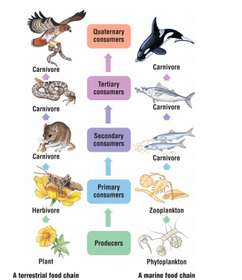
- 80Herbivores, which eat plants, algae, or autotrophic bacteria, are theprimary consumers of an ecosystem
- 81Secondary consumersinclude many small mammals,
such as rodents, and small fishes that eat
zooplankton. - 82Tertiary consumerssuch as snakes, eat mice and
other. secondary consumers - 83Quaternary consumersinclude hawks and killer
whales - 84Detritivores, or decomposers• Derive their energy from the dead material
left by all trophic levels.
• Are often left off of most food chain
diagrams.
Ex. animal scavengers, fungi, and
prokaryotes - 85Food chains interconnect, forming food websA food web is a key
biotic factor in
many ecosystems
– The feeding
relationships in
an ecosystem
• Are typically not
as simple as in
an unbranched
food chain.
• Are usually
woven into
elaborate webs.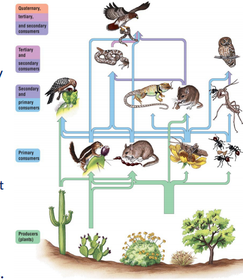
- 86Productivity and the Energy Budgets of EcosystemsBiomass
• Is the amount of organic material in an ecosystem.
– An ecosystem’s primary productivity
• Is the rate at which plants and other producers build
biomass.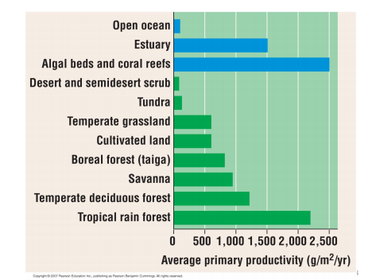
- 87An energy pyramidOnly about 10% of the energy
stored at each trophic level
• is available to the next level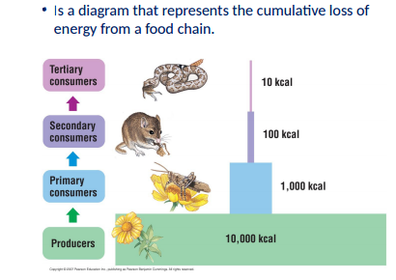
- 88Ecosystem alteration can upset chemical cyclingEcosystem studies show that drastic
alterations, such as the total removal
of vegetation
• can increase the runoff and
loss of soil nutrients - 89Environmental changes caused by humans, such asacid
precipitation
• can unbalance nutrient cycling
over the long term - 90—
Information
- Description
- User has deleted their subject information Flashcards on BISC 100: Lecture 31, 32, 33, 34 :Ecology, created by Deleted user on 10/08/2016.
- Created by
- Deleted user
- Views
- 40
- History
-
- Created by Chelsi Souch · Aug 10, 2016
- Copied by Chelsi Souch · Aug 10, 2016
- Rating