9146100
Description

Flowchart by chloe allen, updated more than 1 year ago
|
|
Created by chloe allen
over 8 years ago
|
|
Flowchart nodes
- Estuaries
- boundaries of estuaries these can not always be fixed boundarieshead - marks the limit of tidal influence -freshwater-seawater changes with tidesmouth -maybe defined by line joining end of river banks -not always defined - river plumes extend further
- typesdrowned river vally - glacier depositfjord - craved out by glacierbar built-sand deposittectonic - drowned faults with crust
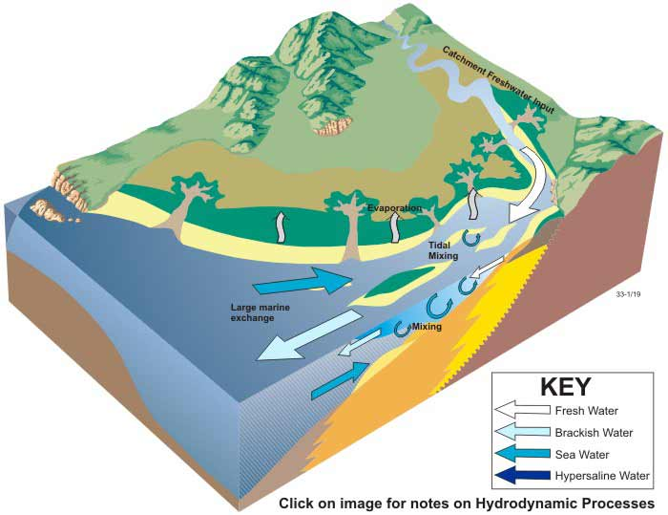
- classification by circulation most are positive.
- positive surface water is directed downstream more saline and therefore dense pushes into the estuary = bottom layer
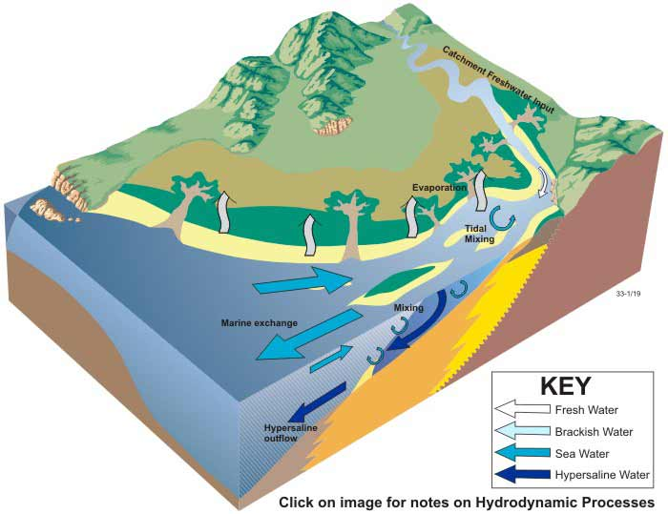
- Negative surface water movement directed inwards - this is driven by intense evaporation cause sinking of highly saline water near the head - so only in aired hot regions
- there are several drivers River flow - freshwater flowing into head - some may recieve large amounts of river input Tidal currents-Reversing direction over one tidal current -current velocities vary with time and depth Gravitational circulation -driven by density -varies with stratification coriolis deflection -only effects wide estuaries cause lateral movement
- classification
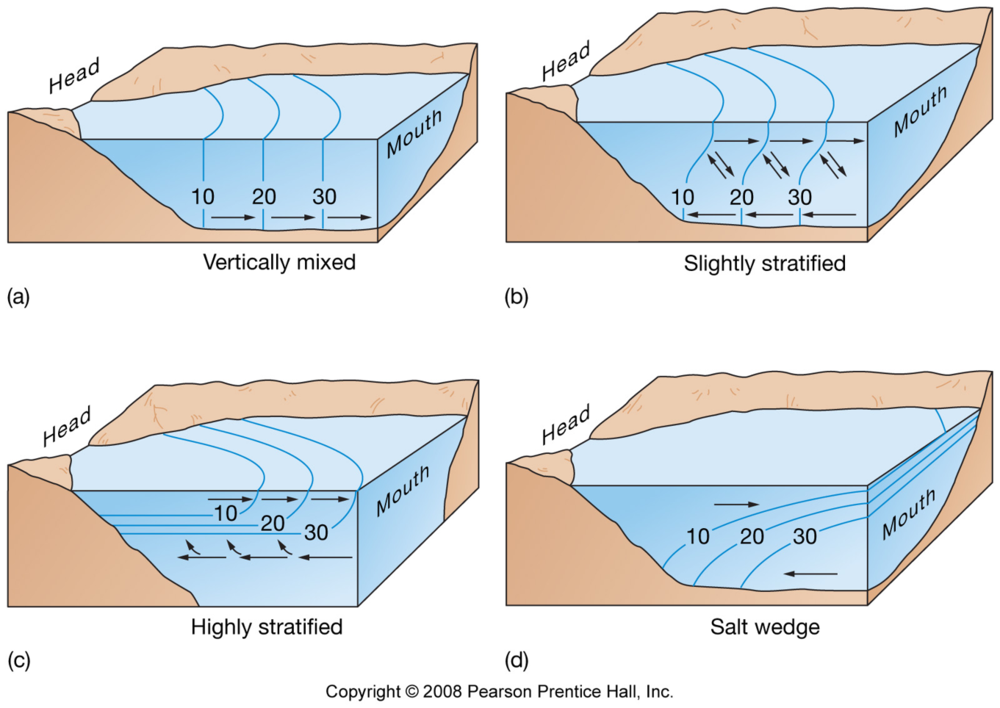
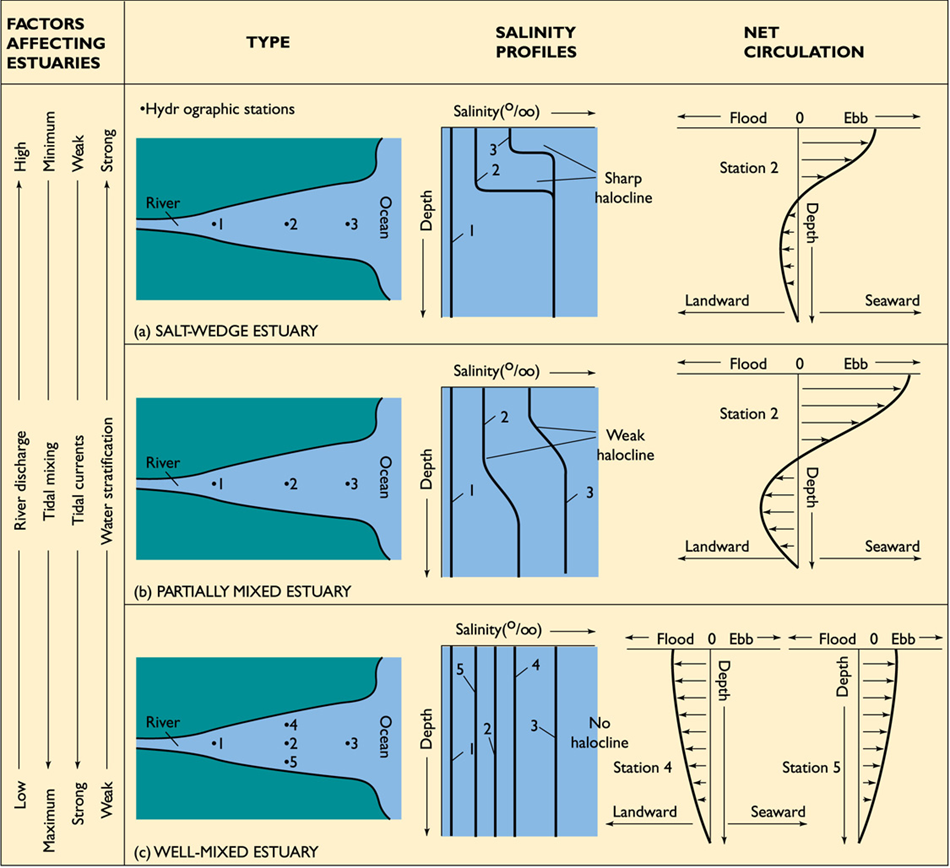
- classification by stratification - salinity layering which can be clear in others
- stratification and circulation these are interrelated -vertically mixed estuaries - surface and bottom layers always move in the same direction - only one that has water moving to river to sea at all depths -stratified and salt wedge -surface and bottom layers move in opposite directionaffected by -riverflow-tidal currents -morphology-bathymetry
- what controls stratification? if the tides are not strong enough =less tidal turbulence =layers arn't mixed well if the estuary is narrower there is more mixing=more friction=less statification
- Flushing times these are important to understand - water exchange, flushing times of dissolved particles and ecology and management the longer the estuarine flushing time the more time avialable for processing - larger estauries with little river in put have long times
- residence time of freshwater is defined T=V/R where r is the discharge calculated by gauging where v volume already in the estuary taken from salinity data as its a conservative property changes due to mixing
- Tidal prism method based on the idea that - incoming coastal seawater during flood mixes with estaurine water -estuary is well mixed at high tide - resulting mix is exposed during ebb - water exchange is soley due to tidal exchange Tf=(T x Vm)/(Vhw - Vlw) T is tidal period Vm is volume at mean sealevel Vh/l is the volume at high and low water respectively
- Fraction method this is calculated form average salinity in the estuary and ave. salinity outside the mouth ff= (Sout+Sin)/Soutthen you times this by the volume given total of freshwater V = ff x Vtthen you can substitute this into the original equation.
- Requirements -rate of river discharge - volume of estuary from bathymetric survey - average salinity from detailed survey
- Advantages - most data readily avilable, except salinity distribution - implicitly accounts for all mixing processesdisadvantages -requires detailed surveys and relys on it - this varies with river flow - requires repeats
- Requirments -tidal hieghts-surface area of estuary -mean depth of the estuary advantages-requires little input of data disadvantages - usually underestimates flushing times due to assuming complete vertical mixing, neglects role of freshwater and gravitaional circulation neglects returning plume waters best from tidal dominated, well mixed estuaries
- these vary with -tides-weaker neap times will cause longer times -river discharge - Tf decrease with river input how they arnt exactly inverse because the freshwater fraction also increase
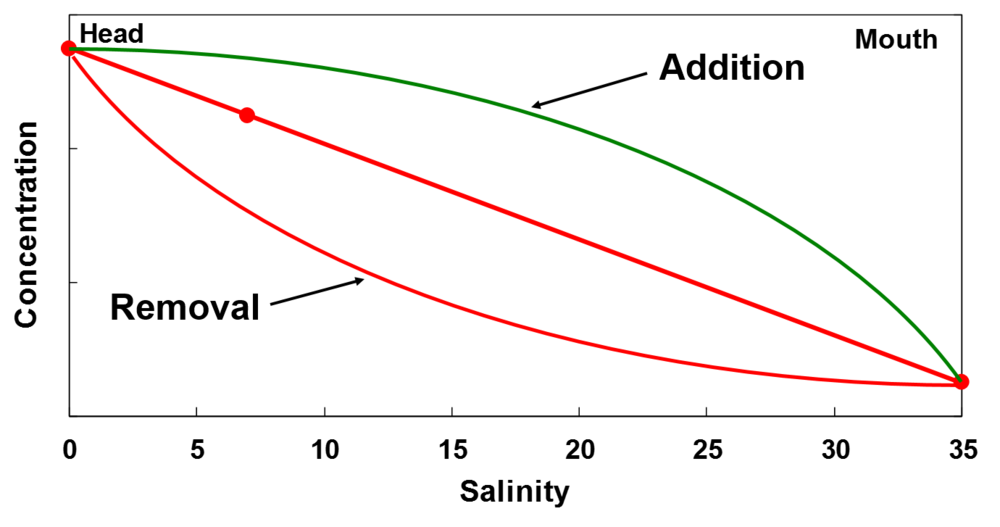
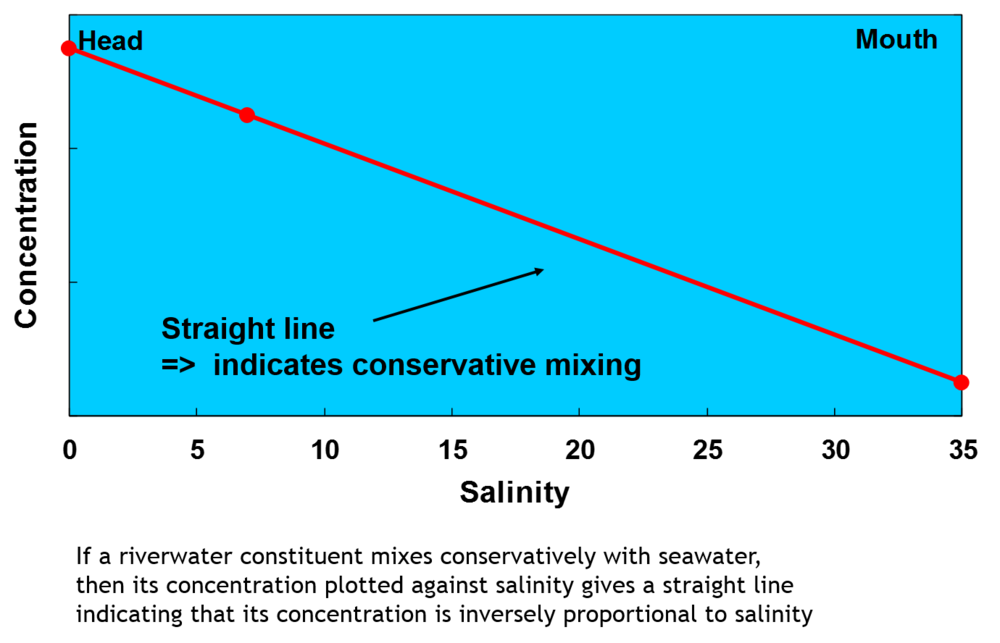
- mixing salinity is a conservative property in positive estuaries, salinity only changes due to mixing between freshwater and coastal water Freshwater fraction is inversely related to salinitytherefore salinity can be used to trace estuarine mixingyhis is done by using the 2 component mixing diagrams
- calculation the salinity from any mixture of two water masses of different salinities is given by: Sab = Fa*Sa + Fb*Sb Sab - salinity of mix Fa/b are the fractions of water masses a and b Sa for estuaries is always o Fa and Fb alwats adds up to one
- 2 component mixing diagram
- Estuarine mixing diagramuseful tool for identifying estuarine processes 2 components mixing diagrams assume the following -2 end member mixing - freshwater input dominant by one river mixes with the water from seawater three possible scenarios - conservative mixing -non-conservative removal or addition of water constituent
- Non-conservative mixing removal and addition must happen during transport - addition is above and removal is below
- removal processes dissolved substances - exists as individual ions moles or atoms so basically anything that can pass through a 0.45 nano meter sieve particular matter - denotes suspended particles retain by a 0.45 mm filter flocculation - some riverine, dissolved organic matter flocculates = suspended particles - also trace metals do this significant trace metals removal from the dissolved phase -estuarine removal is partly resposible for low trace metal concentrations
- mixing and point sources inputs of material or contaminants can be classed as diffuse - urban runoff - inputs from stretches of intertidal areas or wetlands point source - individual sewage outfalls - discharge of tributes with contrasting water properties
- Estuarine Flocculation •occurs mainly in upper reaches near seawater-freshwater interface •Riverine material first exposed to saline water •Upper reaches often have high suspended clay mineral load •This suspended particulate matter (=SPM) promotes flocculation •High SPM loads in upper estuaries result from trapping and resuspension of particulate matter •Estuarine removal often strongest near turbidity maximum - increased turbidity
Want to create your own Flowcharts for free with GoConqr? Learn more.