6472885
Description

Mind Map by valentina Cabrera Vergara, updated more than 1 year ago
|
|
Created by valentina Cabrera Vergara
over 7 years ago
|
|
Gráficos estadísticos
- Representaciones gráficas de datos
- Diagramas de barras
- Se utiliza para información cualitativa o cuantitativa
- Se utiliza para información cualitativa o cuantitativa
- Diagrama de barras proporcionales
- Muestra la composición de una variable según una segunda variable
- Muestra la composición de una variable según una segunda variable
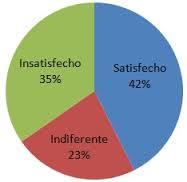
- Diagrama círcular
- Representa variables cualitativas o con pocas categorías
- Representa variables cualitativas o con pocas categorías
- Pictogramas
- Se usan dibujos para representar una frecuencia
- Se usan dibujos para representar una frecuencia
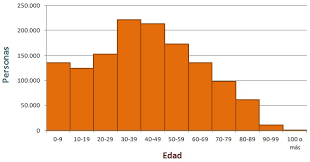
- Histograma
- Se utiliza para representar datos cuantitativos
- Se utiliza para representar datos cuantitativos
- Diagramas de barras
Media attachments
Want to create your own Mind Maps for free with GoConqr? Learn more.