13585116
Description
Mind Map by Charissa Roberts, updated more than 1 year ago
|
|
Created by Charissa Roberts
over 7 years ago
|
|
Statistics Final
- Chapter One
- Definitions
Annotations:
- Data- information coming from observations, counts, measurements, or responses Statistics- the scince of collecting, organizing, analyzing, and interpreting data in order to make decisions Population- the collection of all outcomes, responses, measurements, or counts that are of interest Sample- a subset, or part, of a population Parameter- numerical description of a population characteristic Statistics- a numerical description of a sample characteristic Qualitive- attributes, labels, or nonnumerical entries Quantative- numerical measurements or counts
- Data- information coming from observations, counts, measurements, or responses Statistics- the scince of collecting, organizing, analyzing, and interpreting data in order to make decisions Population- the collection of all outcomes, responses, measurements, or counts that are of interest Sample- a subset, or part, of a population Parameter- numerical description of a population characteristic Statistics- a numerical description of a sample characteristic Qualitive- attributes, labels, or nonnumerical entries Quantative- numerical measurements or counts
- Statistical Study
- Do and observational study
- Preform an experiment
- Use a simulation
- Use a survey
- Types of Studies
- Simple Random Sample
- Stratified
- Cluster
- Systematic
- Convenience
- Simple Random Sample
- Do and observational study
- Definitions
- Chapter Two
- Frequency Distribution
- Definition
Annotations:
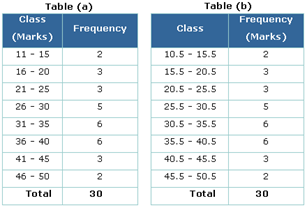
- Frequency distribution- a table that shows classes or intervals of data entries with a count of the number of entries in each class. The frequency of a class is the number of data entries in the class.
- Example
- Definition
- Formulas
- Midpoint
Annotations:
- Midpoint- the sum of the lower and upper class limits of the class divided by two. (lower class limit) + (upper class limit) /2
- Relative frequency
Annotations:
- Relative frequency- the portion or percentage of the data that falls in that class. Frequency divided by the sample size Frequency = Class frequency / Sample size
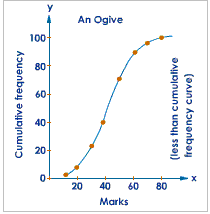
- Cumulative frequency
Annotations:
- Cumulative frequency- the sum of the frequencies of that class and all previous classes.
- Midpoint
- Charts and Graphs
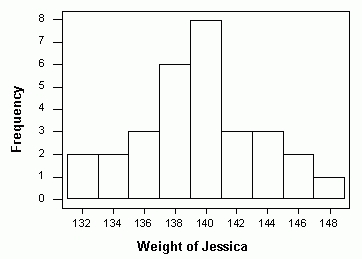
- Frequency Histogram
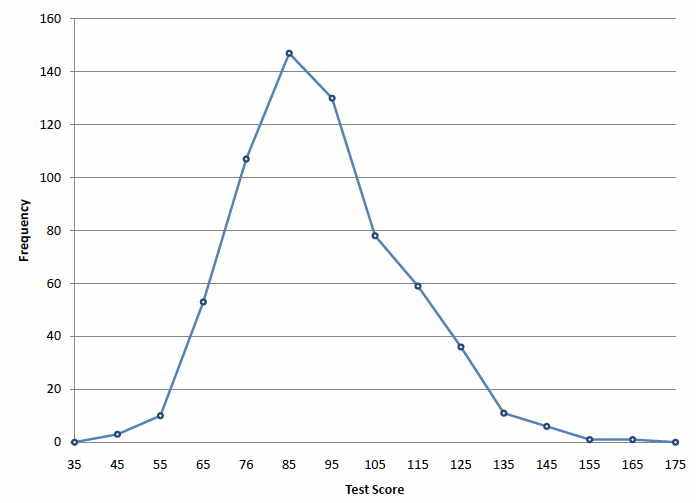
- Frequency Polygon
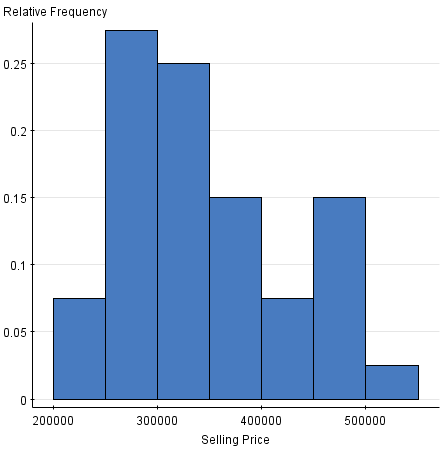
- Relative frequency Histogram
- Ogive
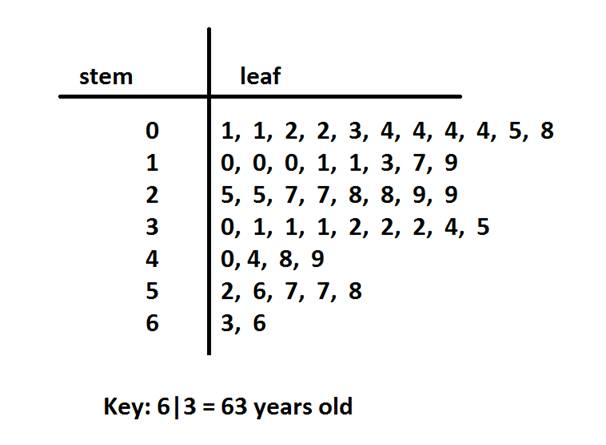
- Stem and Leaf
Plot
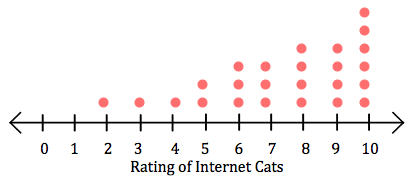
- Dot Plot
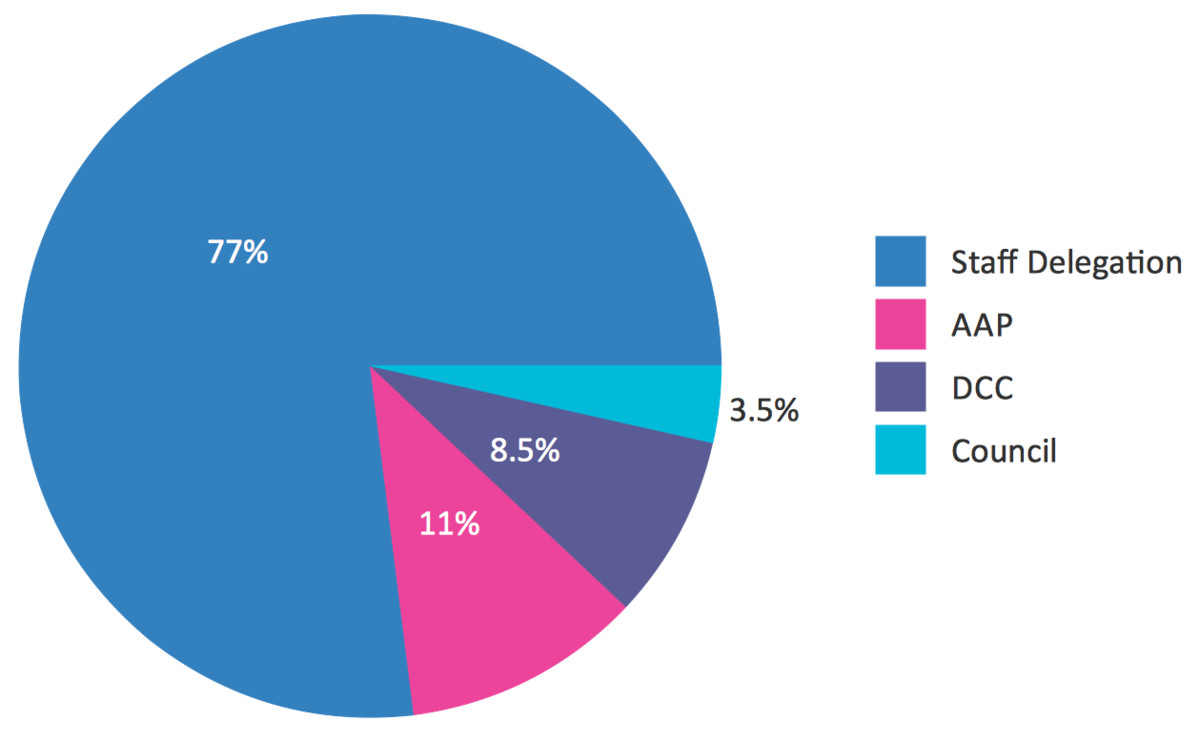
- Pie Chart
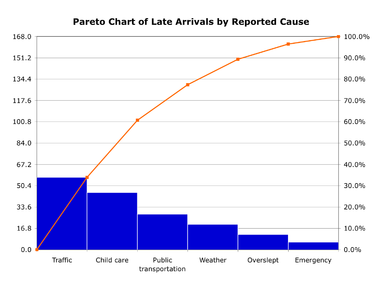
- Pareto
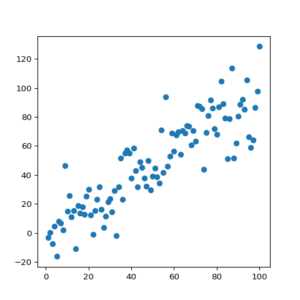
- Scatter
Plot
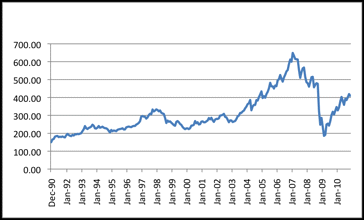
- Time Series chart
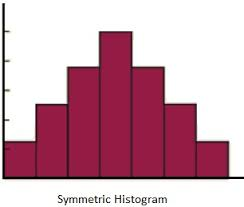
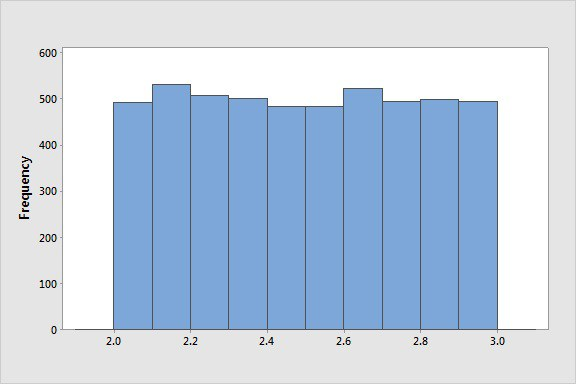
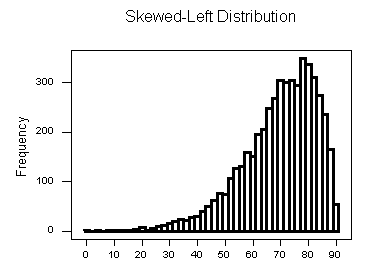
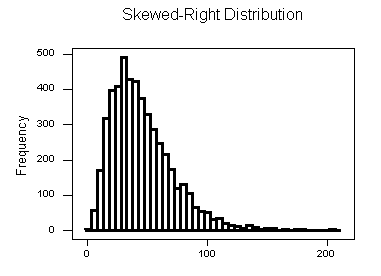
- Shapes of Distributions
- Symmetric
- Uniform
- Skewed Left
- Skewed Right
- Symmetric
- Frequency Histogram
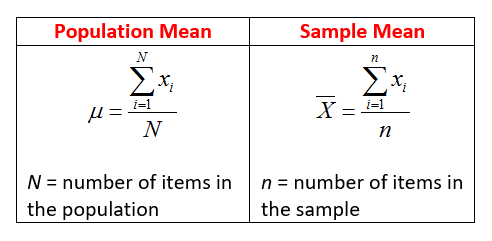
- Population Mean and Sample Mean
- Vocab
- Mean
Annotations:
- Mean- sum of the data entries divided by the number of entries
- Median
Annotations:
- Median- the value that lies in the middle of the data when the data set is ordered
- Mode
Annotations:
- Mode- the data entry with the greatest frequency
- Outlier
Annotations:
- Outlier- a data entry that is far removed from the other entries in the data set
- Mean
- Definitions and formulas
Annotations:
- Range- the difference between the maximum and minimum data entries in the set (quantative). Range = (Maximum data entry) – (Minimum data entry) Deviation- X in a population data set is the difference between the entry and the mean U of the data set Deviation of X= X-U
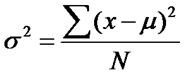
- Population Variance
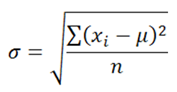
- Population Standard Deviation
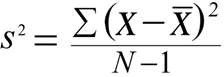
- Sample Variance
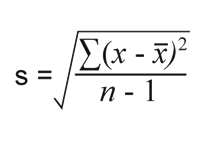
- Sample Standard Deviation
- Others
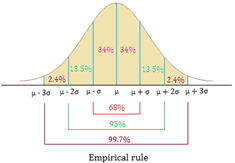
- Empirical Rule
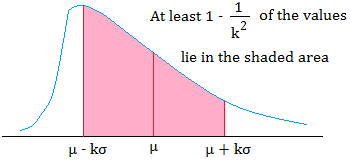
- Chebychev’s Theorem
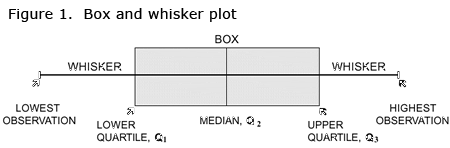
- Box-and-Whisker Plot
- Empirical Rule
- Frequency Distribution
- Chapter Three
- Section One
- Key Facts
- Examples
Annotations:
- -Probabilty Experiment: Roll a six-sided die. -Sample Space: (1,2,3,4,5 -Event:Roll an even number—> (2,4,6) -Outcome:Roll a 2—-> (2)
- Examples
- Vocab
Annotations:
- -Probability experiment: an action through which specific results are obtained -Outcome: the result of a single trial in a probability experiment. -sample space: the set of all possible outcomes of a probability experiment -event: a subset of the sample space. -tree diagram: gives a visual display of the outcomes of a probability experiment by using branches that originate from a starting point. -simple event: event that consists of a single outcome -classical probability: used when each outcome in a sample space is equally likely to occur. -empirical probability: based on observations obtained from probability experiments. -law of large numbers: when you increase the number of times a probability experiment is repeated, and the empirical probability of event approaches the theoretical probability of the event. -subjective probability: results from intuition, educated guesses, and estimates. -complement of event E: the set of all outcomes in a sample space that are no included in event E. -Events are often represented by uppercase letters, such as A,B,and C. -The Fundamental Counting Principle: If one event can occur in m ways and a second event can occur in n ways, the number of ways the two events can occur in sequence in mXn. -The number of ways that events can occur in sequence is found by multiplying the number of ways one event can occur by the number of ways the other events can occur. -Probabilties can be written as Fractions -When an experiment is repeated many times, regular patterns are formed which make it possible to find empirical probability. -Complementary Events: the sum of the probabilities of all outcome sin a sample space is 1 or 100%.
- Key Facts
- Section Two
- Vocab
Annotations:
- -conditional probability: the probability of an event occurring, given that another event has already occurred. -independent: if the occurrence of one or two evens doesn’t affect the probability of the occurrence of the other event. -dependent: if an event is not independent
- Key Facts
- How to use the Multiplication Rule
Annotations:
- 1. Find the probability that the first event occurs 2.Find the probability that the second event occurs given that the first event has occurred 3.Multiply these two probabilities.
- Multiplication Rule
Annotations:
- Multiplication Rule for the probability of A and B: the probability that two events A and B will occur in sequence is: P(A and B) = P(A) x P(B/A)
- How to use the Multiplication Rule
- Vocab
- Section Three
- Vocab
Annotations:
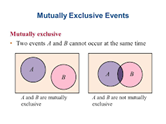
- mutually exclusive: if A and B cannot occur at the same time.
- Mutually exclusive events
Annotations:
- To find the probability that one event or the other will occur, add the individual probabilities of each event and subtract the probability that they both occur.
- Vocab
- Section Four
- Vocab
Annotations:
- -permutation: an ordered arrangement of objects
- Key Concepts
Annotations:
- one can think of a combination of n objects chosen r at a time as a permutation of n objects in which the r selected objects are alike and the remaining n-r (not selected) objects are alike.
- Vocab
- Section One
- Chapter Four
- Section One
- Vocab
Annotations:
- -random variable: represents a numerical value associated with each outcome of a probability experiment. -continuous: if a ransoms variable has an uncontrollable number of possible outcomes, represented by an interval on the number line. -discrete probability distribution: lists each possible value the random variable can assume, together with its probability. -mean: represents the “theoretical average” of a probability experiment and sometimes is not a possible outcome. -expected value: is equal to the mean of the random variable.
- Key Concepts
Annotations:
- - The word random indicates that x is determined by chance. - the mean of a random variable represents the “theoretical average” of a probability experiment and sometimes is not a possible outcome. - Although the mean of the random variable of a probability distribution describes a typical outcome, its best to use the variance and standard deviation of the random variable of a probability distribution to study the variation of the outcomes.
- Different Random Variables
Annotations:
- - Discrete: x can have only whole number value: 0,1,2,3…. - Continuous: x can have any value between 0 and 24. - it’s important to distinguish between discrete and continuous random variables because different statistical techniques are used to analyze each.
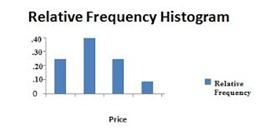
- Relative Frequency Histogram
Annotations:
- Because probabilities represent relati frequencies, a discrete probability distribution can be graphed with a relative frequency histogram
- Vocab
- Section Two
- Vocab
Annotations:
- binomial probability distribution: found by listing the possible values of x with the corresponding probabilities.
- Key Concepts
- Binomial Experiments
Annotations:
- Binomial Experiments satisfy the following conditions: 1.The experiment is repeated for a fixed number of trials, where each trial is independent of the other trials. 2.There are only two possible outcomes of interest for each trial. There can either be a success of a failure. 3.The probability of a success P(S) is the same for each trial. 4.The random variable x counts the number of successful trials.
- Binomial Experiments
- Vocab
- Section Three
- Geometric distribution
- Requirements
Annotations:
- Geometric distribution is a discrete probability distribution of a random variable x that satisfies the following conditions: 1.A trial is repeated until a success occurs 2. The repeated trials are independent of each other. 3.The probability of success p is constant for each trial. 4.The random variable x represents the number of the trial in which the first success occurs.
- Requirements
- Poisson distribution
- Requirements
Annotations:
- Poisson distribution is a discrete probability distribution of a random variable x that satisfies the following conditions: 1.The experiment consists of counting the number of times x an event occurs in a given interval. The interval can be an interval of time, are, or volume. 2.The probability of the event occurring is the same for each interval. 3. The number of occurrences in one internal is independent of the number of occurrences in other intervals.
- Requirements
- Geometric distribution
- Section One
Media attachments
Want to create your own Mind Maps for free with GoConqr? Learn more.