
Mind map
Weight potometer experiment
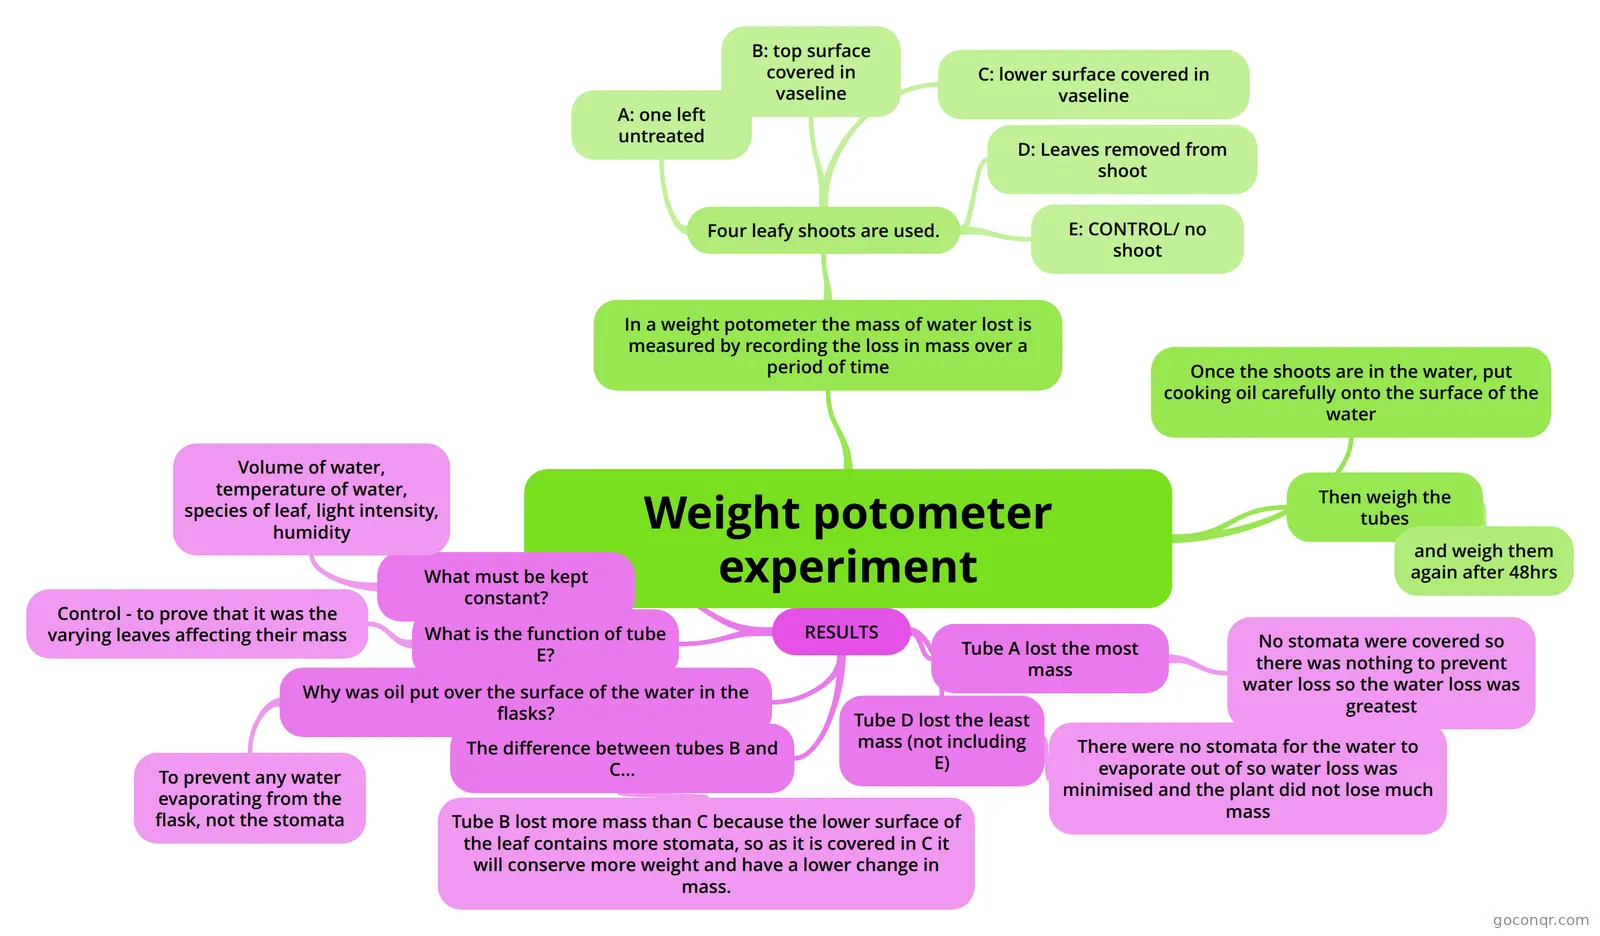
Mind map: Weight potometer experiment
Map content
Weight potometer experiment
In a weight potometer the mass of water lost is measured by recording the loss in mass over a period of time
- Four leafy shoots are used.
- A: one left untreated
- B: top surface covered in vaseline
- C: lower surface covered in vaseline
- D: Leaves removed from shoot
- E: CONTROL/ no shoot
- Four leafy shoots are used.
Once the shoots are in the water, put cooking oil carefully onto the surface of the water
Then weigh the tubes
- and weigh them again after 48hrs
RESULTS
- Tube A lost the most mass
- No stomata were covered so there was nothing to prevent water loss so the water loss was greatest
- Tube D lost the least mass (not including E)
- There were no stomata for the water to evaporate out of so water loss was minimised and the plant did not lose much mass
- The difference between tubes B and C...
- Tube B lost more mass than C because the lower surface of the leaf contains more stomata, so as it is covered in C it will conserve more weight and have a lower change in mass.
- Why was oil put over the surface of the water in the flasks?
- To prevent any water evaporating from the flask, not the stomata
- What is the function of tube E?
- Control - to prove that it was the varying leaves affecting their mass
- What must be kept constant?
- Volume of water, temperature of water, species of leaf, light intensity, humidity
- Tube A lost the most mass
Information
- Description
- GCSE Biology Mind Map on Weight potometer experiment, created by jeacur on 16/08/2013.
- Created by
- jeacur
- Views
- 1,111
- Tags
- Rating