
Mind map
The Sun (2)
Map content
The Sun (2)
Sunspot cycle
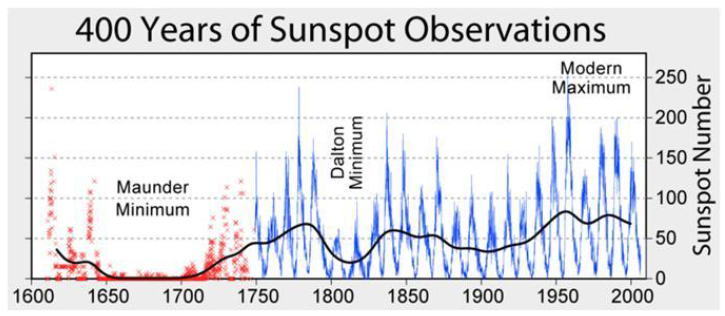
- the average no. of sunspots reaches a mx every 11 or so years & then falls off almost to 0 before the cycle begins afresh
- at the start if the each cycle, at solar minimum, only a few spots are seen
- approx 4 years into the cycle, around solar minimum, the no. of spots increases markedly
Current Cycle
- current solar cycle, began in 2008 January, but there was minimal activity until early 2010
- it is on track to be the Solar Cycle with the lowest recorded sunspot activity since accurate records began in 1750
- current solar cycle, began in 2008 January, but there was minimal activity until early 2010
solar storms
- large solar flares often occur during a solar max
- coronal clouds associated with CMEs produced by solar flares often caused the solar storms
- For Eg) the solar storm of 1859 struck the Earth with such intensity that aurorae could be seen as far south as Rome, approx 42deg north of the equator
- coronal clouds associated with CMEs produced by solar flares often caused the solar storms
- solar storms can produce intense geomagnetic & proton sotrms capable of cuasing sever damage to technology
- intense solar sotrms may also be hazardous to high-latitude, high-altitude aviation & to human spaceflight
- stability of modern civilisation?
- the damage from the most potent solar storms is capable of threatening the stability of moderm human civilisation
- stability of modern civilisation?
- intense solar sotrms may also be hazardous to high-latitude, high-altitude aviation & to human spaceflight
- large solar flares often occur during a solar max
Images and files in the map
Information
- Description
- Mind Map on The Sun (2), created by hssue94712 on 12/04/2015.
- Created by
- hssue94712
- Views
- 0
- Rating