4062846
Description
Mind Map by Charlotte Brown, updated more than 1 year ago
|
|
Created by Charlotte Brown
about 10 years ago
|
|
Types of distributions
Annotations:
- These distributions are used for discrete data
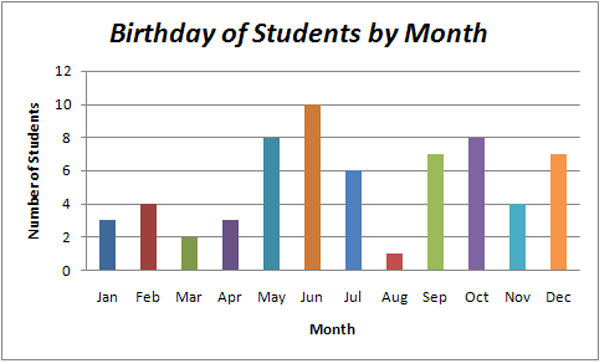
- Discrete random variable
- Often presented as a frequency
chart or bar graph. We are able to
find the expected value and variance.
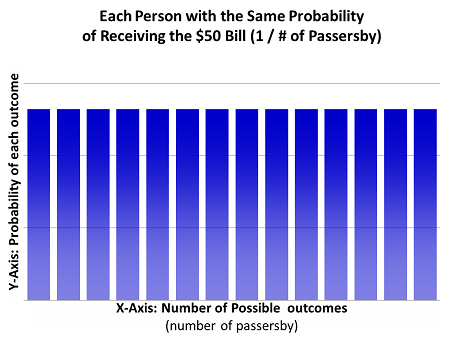
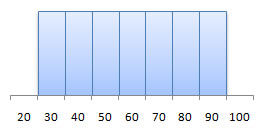
- Could be a rectangular distribution- bars
the same height
- Could be a rectangular distribution- bars
the same height
- Often presented as a frequency
chart or bar graph. We are able to
find the expected value and variance.
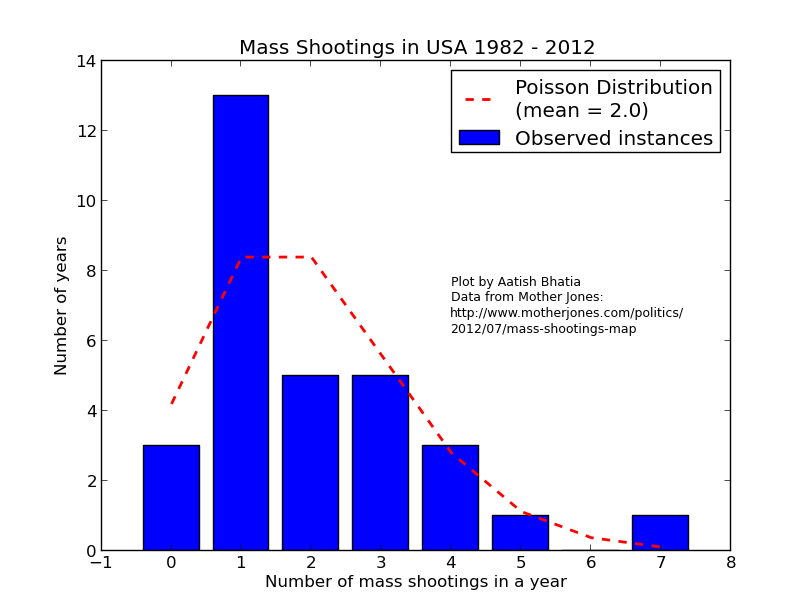
- Poisson distribution
- Random discrete events over a
continuous interval. Usually
presented as a rate or average per
interval.
- Conditions:
*events or
happenings must
occur at random
*each event or
happening must
be independent of
any others
*events cannot
occur
simultaneously
*the rate at which
an event occurs is
constant
- Conditions:
*events or
happenings must
occur at random
*each event or
happening must
be independent of
any others
*events cannot
occur
simultaneously
*the rate at which
an event occurs is
constant
- Random discrete events over a
continuous interval. Usually
presented as a rate or average per
interval.
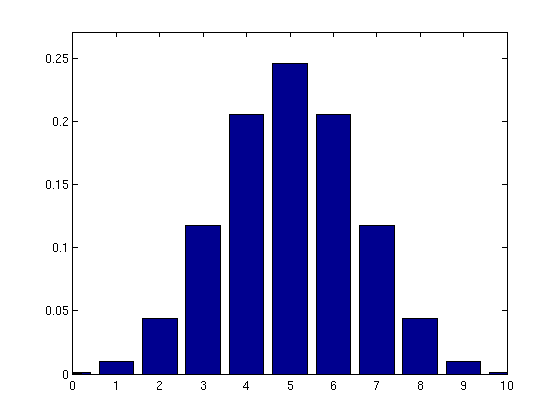
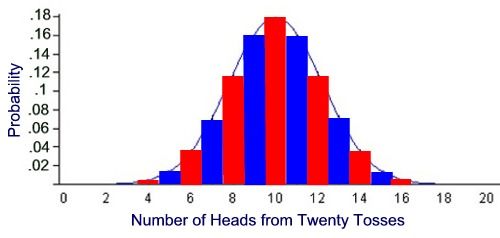
- Binomial distribution
- Set number of trials with
the same probability in
each trial. Only two
possible outcomes.
- Conditions:
*the number of
trials must be
fixed *each
trial must
result in either
success of
failure *each
trial must be
independent of
the others *the
probability of
success at each
trial must be
the same
- Conditions:
*the number of
trials must be
fixed *each
trial must
result in either
success of
failure *each
trial must be
independent of
the others *the
probability of
success at each
trial must be
the same
- Set number of trials with
the same probability in
each trial. Only two
possible outcomes.
- Normal distribution
Annotations:
- These distributions are used for continuous data
- With a continuity correction we can
sometimes model a discrete dist with
a normal dist
- Bell shaped curve. A measures quantity in a
measured interval. Often a good representation
for naturally occurring measurement data.
- Conditions:
*it is a bell
shaped
curve
symmetrical
about the
mean *the
area under
the curve is
one *there
will be about
six standard
deviation
over the
range of the
dist
- Conditions:
*it is a bell
shaped
curve
symmetrical
about the
mean *the
area under
the curve is
one *there
will be about
six standard
deviation
over the
range of the
dist
- Bell shaped curve. A measures quantity in a
measured interval. Often a good representation
for naturally occurring measurement data.
- Uniform distribution
- Where we know maximum and
minimum values and we have no
basis for assuming a particular
shape to the dist. Sometimes
called Continuous Rectangular
Distribution.
- Where we know maximum and
minimum values and we have no
basis for assuming a particular
shape to the dist. Sometimes
called Continuous Rectangular
Distribution.
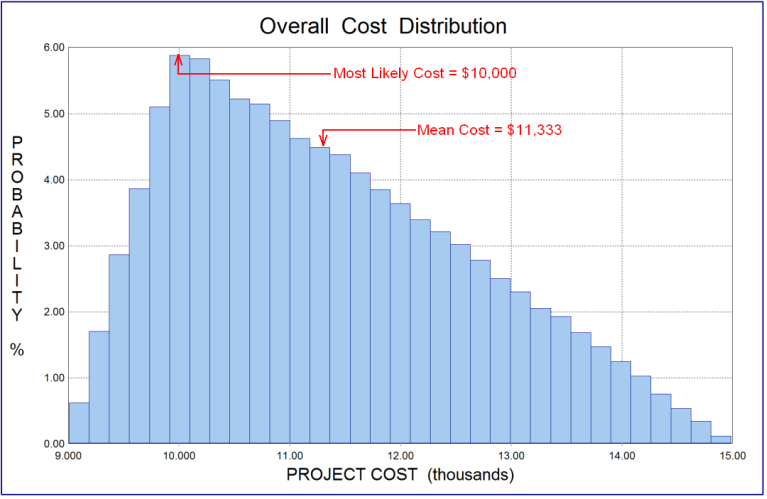
- Triangular distribution
- Where we know maximum, minimum and
mode values and we assume a linear increase
from minimum to mode and then down to the
maximum.
- Where we know maximum, minimum and
mode values and we assume a linear increase
from minimum to mode and then down to the
maximum.
Media attachments
Want to create your own Mind Maps for free with GoConqr? Learn more.