441707
Description
Mind Map by Steve Hiscock, updated more than 1 year ago
|
|
Created by Steve Hiscock
about 12 years ago
|
|
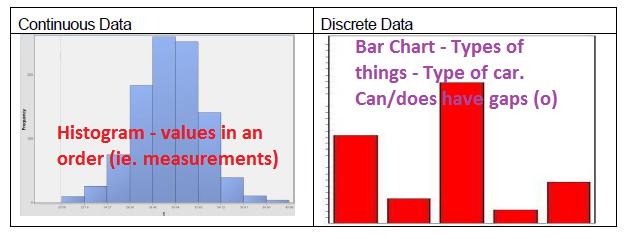
EDA - Visualisation
- Basic Plots
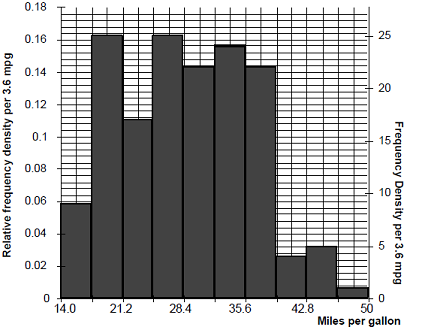
- When combining categories in histograms
- 1. Combine the 2> values
- 2. Divide the values by the number of bars
being represented for that range
- 3. This will create an averaged set of bars across
the range (Changing the shape of the histogram)
- 3. This will create an averaged set of bars across
the range (Changing the shape of the histogram)
- 2. Divide the values by the number of bars
being represented for that range
- Bars don't have to
be the same width -
Its all about AREA.... Not HEIGHT
- 1. Combine the 2> values
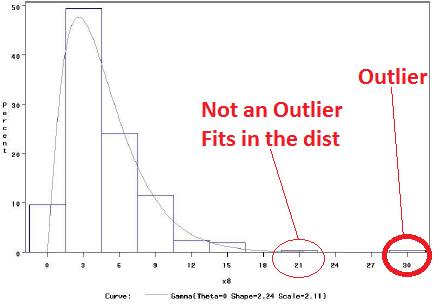
- Distribution Shapes
- Bulk of Density
- Modal Values
- irregular
- Bulk of Density
- Relative Frequency Density - Asymmetrical
- Outliers
- Measures of location
- Mean
- Add all the values and
divide by the number of
values
- Add all the values and
divide by the number of
values
- Mode
- Most common value
- Modal Class vs. Mode Tables.
Can appear differently. Class is
important. The
resolution/number of bars can
better determine the mode
- Most common value
- Median
- The middle number
- The middle number
- Variance = average of squared differences about the mean
- Always divide by
one less than the
sample size -
Don't include your
mean
- Measures the spread of the data
- Variance Square Rooted = Standard Deviation
- How spread out the data is
- Zero = Max & Min's the same
- Zero = Max & Min's the same
- How spread out the data is
- Always divide by
one less than the
sample size -
Don't include your
mean
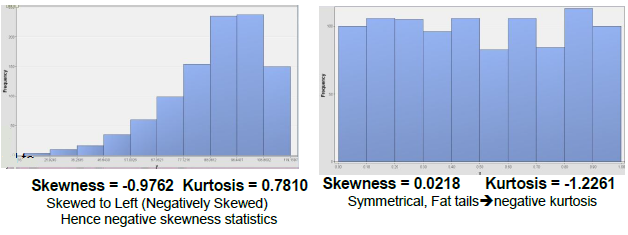
- Skew - 0 = Symeteric
- Kurtosis
- Tail Fatness - Higher numbers thinner tails
- Tail Fatness - Higher numbers thinner tails
- Mean
Media attachments
Want to create your own Mind Maps for free with GoConqr? Learn more.