
Mind map
1_Ch (5,7-13) Analyzing Neural Time Series Data
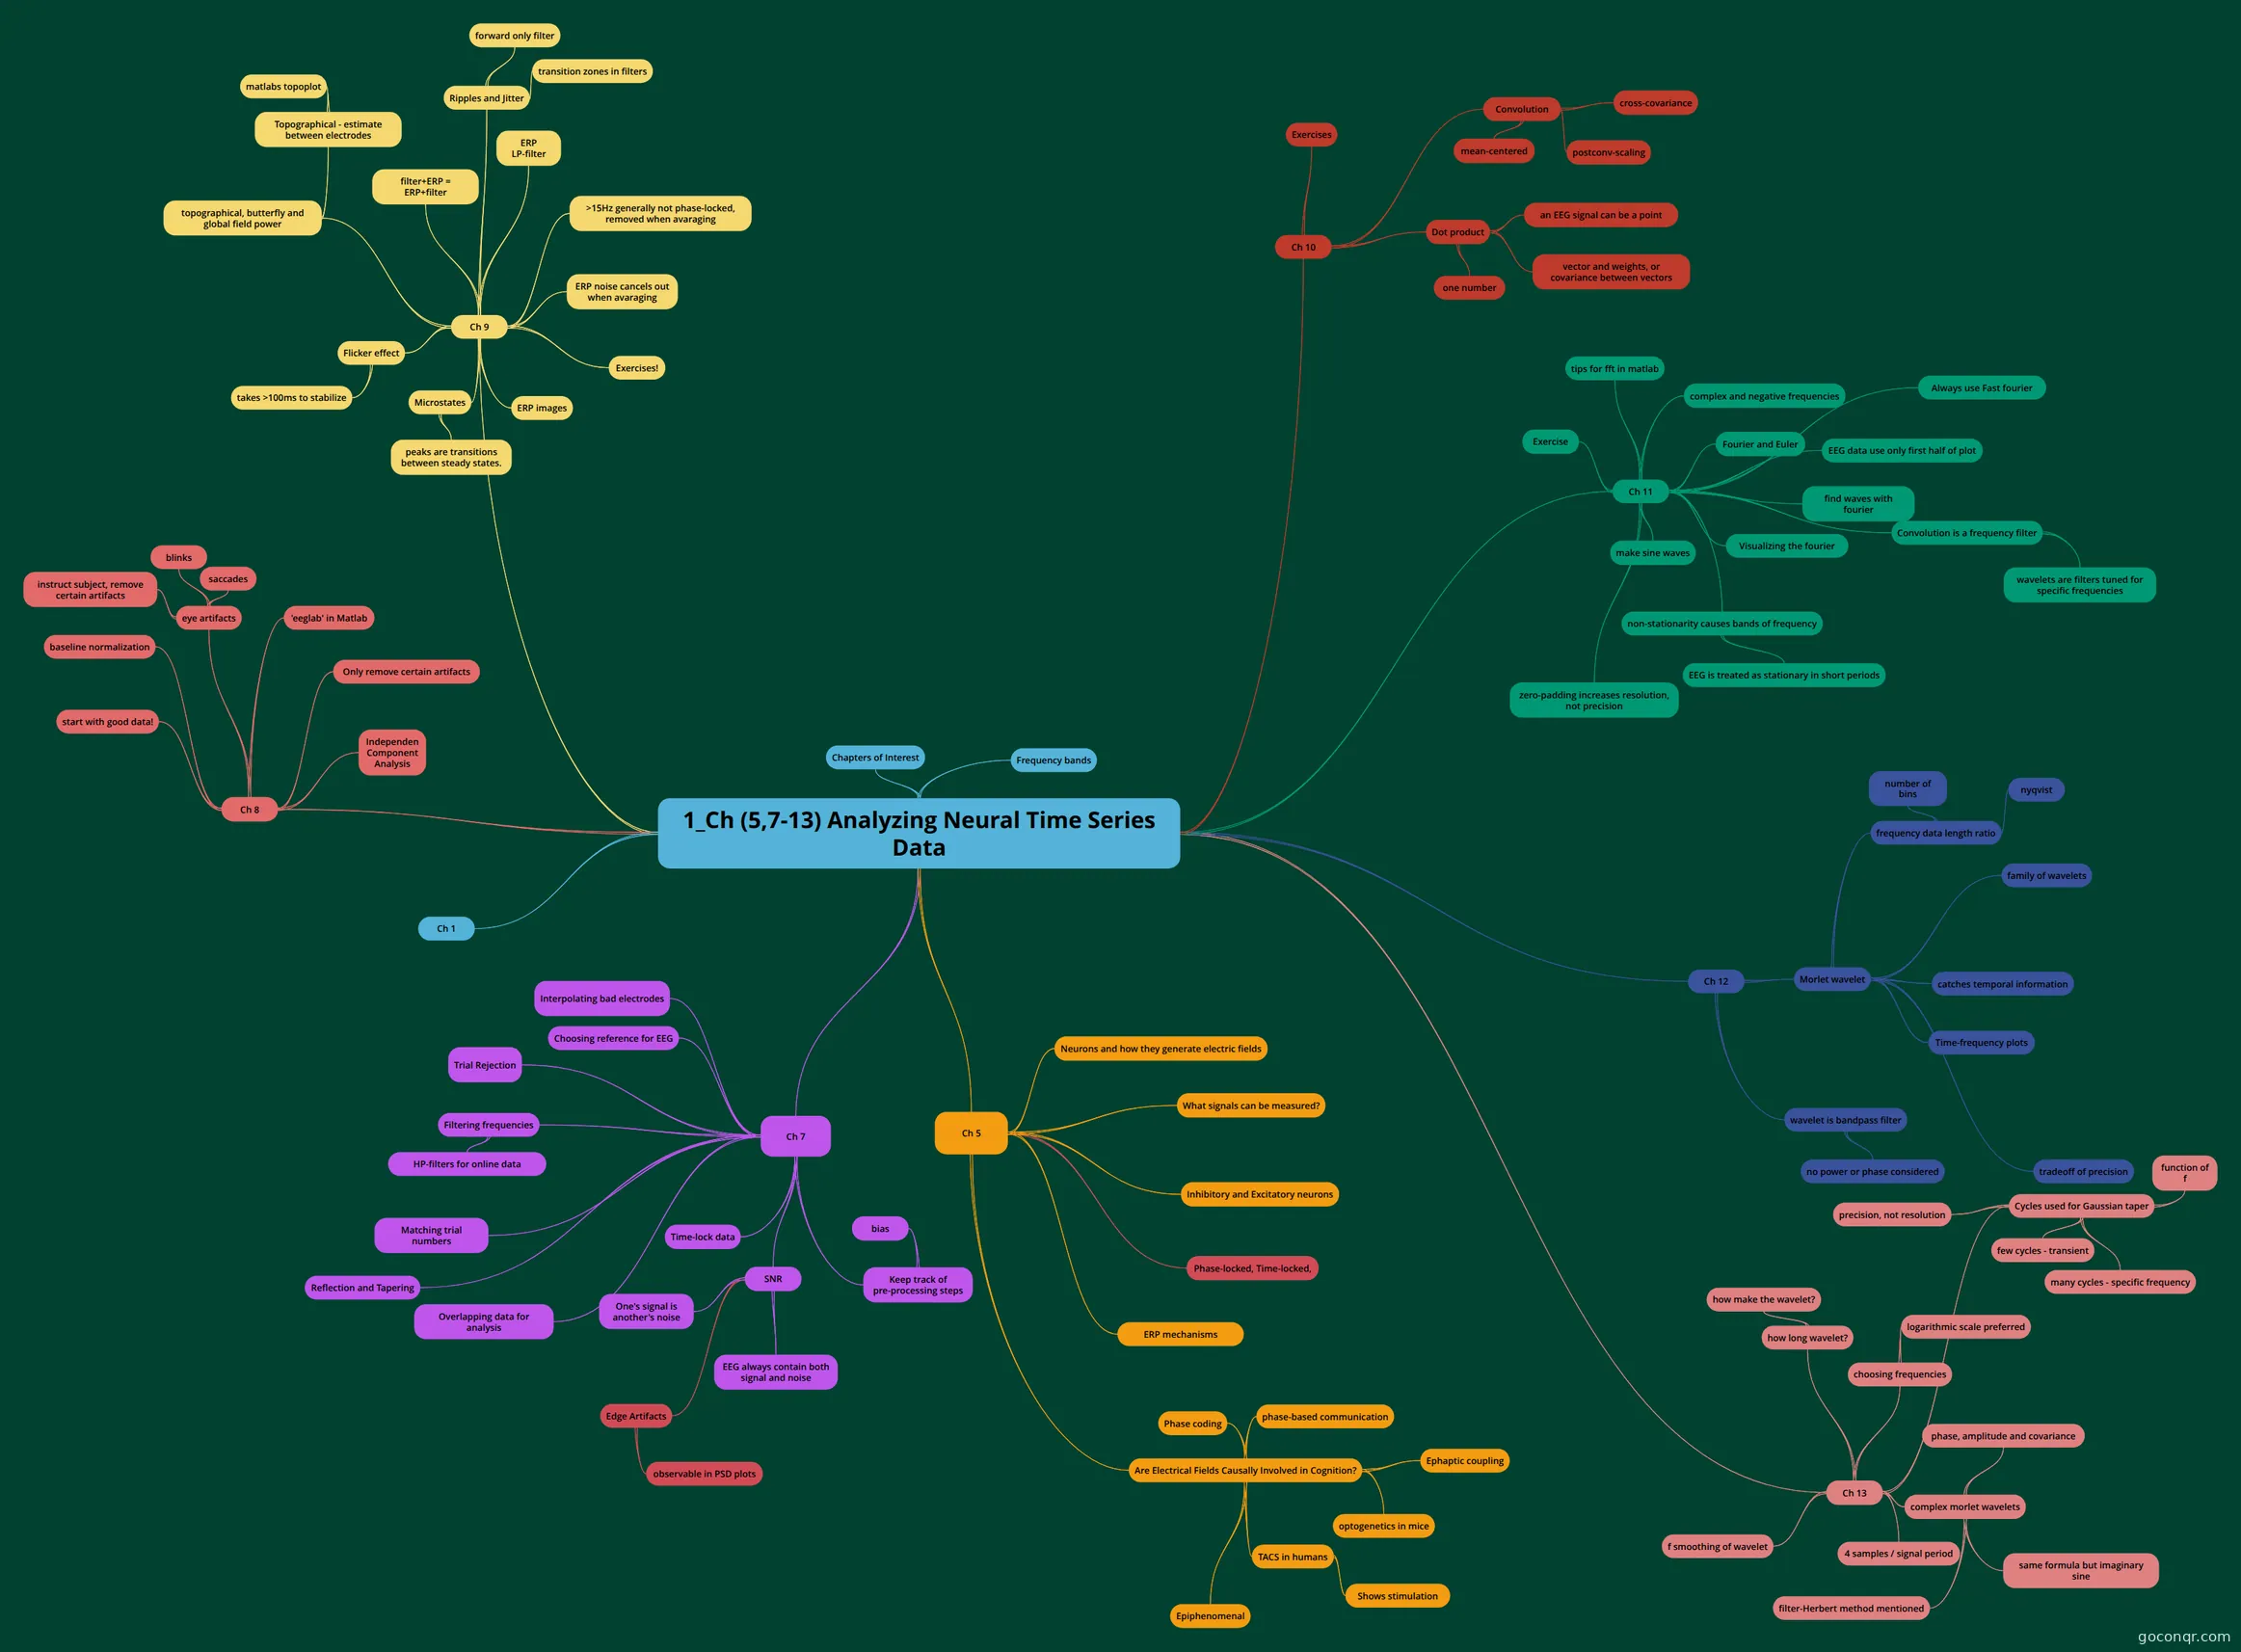
Mind map: Analyzing neural time series data
Map content
1_Ch (5,7-13) Analyzing Neural Time Series Data
- by Mike X Cohen
Ch 1
Ch 5
- Neurons and how they generate electric fields
- What signals can be measured?
- Inhibitory and Excitatory neurons
- Phase-locked, Time-locked,
- "Baseline Normalization" is said in book to remove background activity and unrelated signals.
- ERP mechanisms
- Are Electrical Fields Causally Involved in Cognition?
- Phase coding
- phase-based communication
- Ephaptic coupling
- Ephaptic coupling is the non-direct communication between neurons caused by their electric fields during neural activity. This suggests that electrical activity is caused by cognition.
- optogenetics in mice
- TACS in humans
- Transcranial Alternating Current Stimulation
- Shows stimulation
- Putting 20Hz over the motor cortex increases motor evoked potential magnitude, but other frequencies have no effect.
- Epiphenomenal
Frequency bands
- Name: Bandwidth Delta: <4 Theta: 4-7 Alpha: 8-15 Beta: 16-31 Gamma: >32 Mu: 8-12
Ch 7
- Pre-Processing
- Keep track of pre-processing steps
- what electrodes were rejected, what filter was applied, what artifacts was removed etc
- bias
- bias may be introduced during preprocessing. be Consistent
- SNR
- Signal to Noise Ratio Signal Power--------------------- = SNR Noise Power
- EEG always contain both signal and noise
- One's signal is another's noise
- Scientists use different frequency bands as their signal, meaning that some focus on >30Hz while others filter >30Hz away. It depends on the research and the scientists.
- Edge Artifacts
- Present at start and end of every epoch. said in book to be 3 cycles, meaning lower frequencies need more buffer time before and after the epoch. Book suggests 1500milliseconds before and after the window of interest, for a minimum of 2 Hz signal detection (up to any upper limit)
- observable in PSD plots
- Time-lock data
- We will use stimulus on data which naturally time-locks start and stop. This time-locked data is called an Epoch. It's important to reduce edge artifacts by finding the window of interest.
- Overlapping data for analysis
- can cause bias since some points will be analyzed more than others. Make sure ICA analyzes each point of data exactly once.
- Reflection and Tapering
- Reflection is a method for when data is epoched and edge artifacts may be present. Instead of re-epoching, Tapering data at beginning and end should reduce edge artifacts influence on analysis. Book suggests taking longer epochs and avoiding reflection and tapering.
- Matching trial numbers
- Filtering frequencies
- HP-filters for online data
- Trial Rejection
- manual and automatic
- Choosing reference for EEG
- Can be done afterwards, offline
- Interpolating bad electrodes
- NOT advised by book
Chapters of Interest
- LÄS 2,3,7,8,9,10,11,12,13,18,20,21skumma 5, överväg 6
Ch 8
- Independen Component Analysis
- Only remove certain artifacts
- 'eeglab' in Matlab
- eye artifacts
- blinks
- saccades
- instruct subject, remove certain artifacts
- baseline normalization
- start with good data!
Ch 9
- ERP noise cancels out when avaraging
- >15Hz generally not phase-locked, removed when avaraging
- ERP LP-filter
- Ripples and Jitter
- Ripples are generated artifacts from transitions in voltage. It can be explained with the overshoot and oscillations of a step-response of a filter. Jitter is the deviation of perfect periodicity.
- transition zones in filters
- more generous(longer) transition zones in filters help avoiding ripples
- forward only filter
- ... can cause bias in the analysis. Use backward and forward filtering to avoid!
- filter+ERP = ERP+filter
- topographical, butterfly and global field power
- Topographical - estimate between electrodes
- matlabs topoplot
- Topographical - estimate between electrodes
- Flicker effect
- when watching or hearing a frequency, that frequency can be measured in the brain.
- takes >100ms to stabilize
- a few hundred ms to stabilize the effect.
- Microstates
- peaks are transitions between steady states.
- more on scholarpedia - EEG_microstates
- peaks are transitions between steady states.
- ERP images
- info about ERP images, showing Trials and time as dimensions on a plot and the tendencies. Matlab has tools to smooth plots and more.
- Exercises!
Ch 10
- Dot product
- vector and weights, or covariance between vectors
- This is the basis for finding the covariance between specific sine waves and an eeg signal.
- one number
- the result of every dot product is always one number
- an EEG signal can be a point
- if an EEG signal consists of 100 points, it can be viewed as a single point in a 100dimensional space.
- vector and weights, or covariance between vectors
- Convolution
- One vector is signal, the other is kernel. EEG is often concidered signal but computationally, it doesn't matter. A sliding dot product of two signals = convolution.
- mean-centered
- this type of convolution produces negative values
- postconv-scaling
- scale the resulting signal with the sum of all convolution points. NOT same as mean-centering the kernel
- cross-covariance
- cross-covariance does not flip the kernel backwards while convolution do. This means that if the kernel is symmetric on both sides of its center, then cross-covariance and convolution are identical!
- Exercises
- Dot product
Ch 11
- make sine waves
- find waves with fourier
- Exercise
- program the discrete fourier transform for understanding the most vital point in signal processing!
- Fourier and Euler
- Visualizing the fourier
- complex and negative frequencies
- EEG data use only first half of plot
- fourier transform gives negative frequencies in the second half of the plot, but these mirror the real frequencies for EEG data and alike. Save the imaginary data because its needed for inverse fourier transform
- Always use Fast fourier
- And never the ordinary Discrete Fourier Transform. The difference in computation speed is VAST
- non-stationarity causes bands of frequency
- and its not an artifact of the fourier, its a feature.
- EEG is treated as stationary in short periods
- these short periods can be for example 1/16th of a second, or a few hundred milliseconds.
- zero-padding increases resolution, not precision
- Convolution is a frequency filter
- wavelets are filters tuned for specific frequencies
- tips for fft in matlab
- using conv for convolution of wavelets are redundant and takes lots of time but can be used to check correctness of code
Ch 12
- Morlet wavelet
- sine wave windowed with gaussian. its frequency is called peak frequency
- catches temporal information
- each point is a weighted sum of frequency information of surrounding time points, with decreasing weight on distant points.
- tradeoff of precision
- n is a parameter which gives relation between temporal precision and frequency precision. In example, n=6.
- family of wavelets
- same properties but different frequencies
- frequency data length ratio
- for one second trial, measure 4 Hz or more. At least 4 signal periods should fit the analyzed data sequence.
- nyqvist
- number of bins
- Time-frequency plots
- How coloring help view 3-D in 2-d plots. Ups and Downs of the line are colored as GreenYellowRed for up and Blue for down
- wavelet is bandpass filter
- no power or phase considered
- Morlet wavelet
Ch 13
- complex morlet wavelets
- same formula but imaginary sine
- phase, amplitude and covariance
- filter-Herbert method mentioned
- 4 samples / signal period
- choosing frequencies
- hypothesis-driven analysis might only require small bands to analyze, but some margins are always good.
- logarithmic scale preferred
- hen remember to fix the Y-scale of the plot because it will be wrong. see matlab function 'contour'
- how long wavelet?
- 4seconds perhaps. the wavelet should taper to zero at both positive and negative ends
- how make the wavelet?
- use range N:N where N is a digit. This makes odd number of samples which is good for wavelet.
- Cycles used for Gaussian taper
- This is the number N which determines the tradeoff between frequency precision and temporal precision.
- precision, not resolution
- resolution, both temporal and frequency, are determined by the data-sampling rate.
- few cycles - transient
- better catching dynamics in time
- many cycles - specific frequency
- better catches the frequency of the dynamic
- function of f
- f smoothing of wavelet
- FWHM = full width half maximum
- complex morlet wavelets
Information
- Description
- Masters Degree Jonatan Tidare Mind Map on 1_Ch (5,7-13) Analyzing Neural Time Series Data, created by Jonatan Tidare on 22/03/2016.
- Created by
- Jonatan Tidare
- Views
- 0
- History
-
- Created by Jonatan Tidare · Mar 22, 2016
- Copied by Jonatan Tidare · Mar 22, 2016
- Rating
More on EEG and Electrophysiology