
Mind map
Financial Statement analysis
Map content
Financial Statement analysis
Bókin skiptist í fjóra hluta
- The book is dived into four parts 1. Accounting data 2. Financial analysis 3. Decision making 4. Assessment of accounting data
- Accounting Data
- Accounting data. Bookkeeping for presenting financail statements
- Kafli 1 (Intro)
- Kafli 2 (Bookkeeping)
- Kafli 3 (Acc vc CF)
- Two types of value creation measures
- Accrual-based performance measure
- Cash-flow-based performance measures
- Two types of value creation measures
- Financial statement
- The financial statement is divided into three parts.
- 1.Income statement
- The income statement show revenues subtracted from expense
- 2.Balance sheet
- Balance sheet is a summery of assets, liabilities and equities in the end of the fiscal year.
- 3.Cash flow statement
- Cash flow statements report what the company is spending their money on. It consist of three parts 1. Operating activities 2. Investment activities 3. Financing activities
- Kafli 3 (Acc vc CF)
- Three important types of decision makers
- There are many different decision makers. But the three important ones are. 1. Equity-oriented stakeholders f.ex. Investors, companies, pension funds Want the value of the company to decide whether to buy more or sell. 2. Debt-capital-oriented stakeholders f.ex. Banks, Mortgage credit institutes Want to know who the company pays its debt 3. Compensation-oriented stakeholders f.ex. Management, The Board, Investors Want to know how the company is performing because of cash bonus or performance bonus
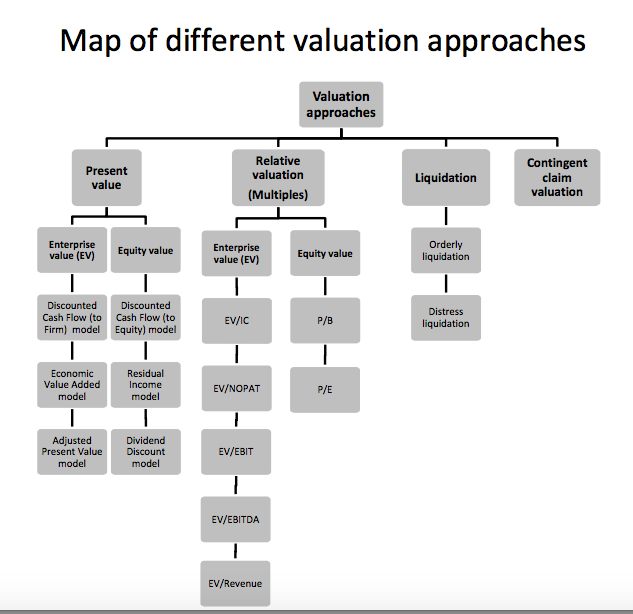
- Valutaion approaches
- Equity
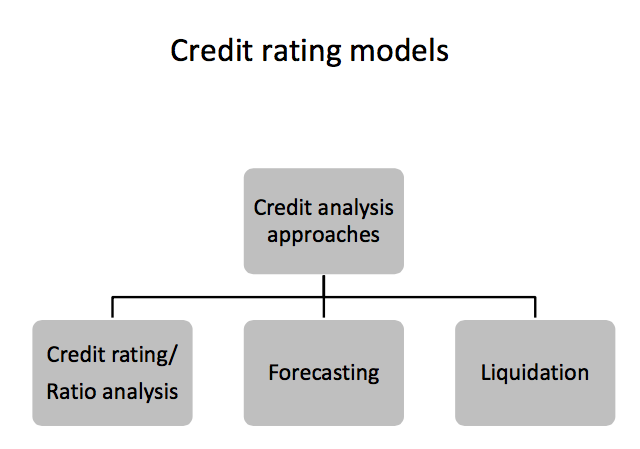
- Debt
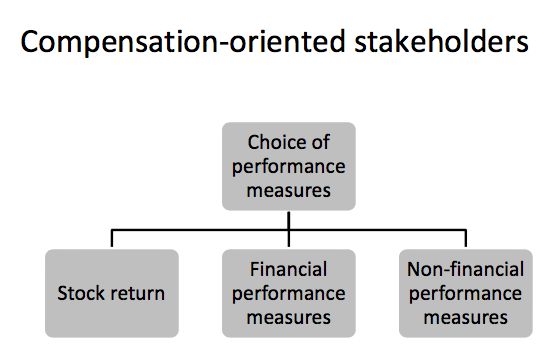
- Performance
- Kafli 2 (Bookkeeping)
- Financial analysis
- Measuring a firms profitability, growth and risk. Measure growth and ensure profits. Monitor liquidity risk
- Kafli 4 (The analytical statement)
- Financial statement
- A firm consists of operating, investing and financing activities. It is important to separate the operating and investing activities from the financing activities because the operating items are the primary force behind value creation. So we need to highlight the sources of value creation in order to measure a firm’s profitability. Further more the company’s operation (or business plan) is what’s unique not the financial activates.
- Operating activity
- Operating activities pertain to a company's core business activities, such as manufacturing, distributing, marketing and selling a product or service. These activities should provide the majority of a company's cash flow and will largely determine whether a company is profitable F.ex. Property plant, equipment and inventory are operating items
- Analytical statement
- When separating operating- from financing activity you create the analytical income statement and the analytical balance sheet where accounting items has been classified.
- Financing activity
- Financing activities are external activities that allow a firm to raise capital and repay investors, such as issuing cash dividends, adding or changing loans or issuing more stock. If it’s interest bearing it should be classified as financing activity according to the book. But according to Ole (Teacher) retirement benefits should be more part of operating liabilities than financing operations. F.ex. Bank loans and equity
- Grey areas
- Separating operating- and finance activity is easier said than done. Remember the rule apple for an apple. But there are grey areas
- Financing activity
- Kafli 5 (Profitability analysis)
- Kafli 6 (Growth analysis)
- Kafli 7 (Liquidity risk analysis)
- Liquidity is important for any business because without it companies cannot pay its bills. There for it is important to analyze short and long term liquidity risk
- Short-term liquidity risk
- Short-term liquidity risk is the company’s ability to pay short-term debt. There are different ways of measuring short-term liquidity risk. A convincing action plan to overcome short term funding problems will most likely convince shareholders and lenders to provide the necessary funding.
- Liquidity cycle
- As an indicator of the short term liquidity risk this shows us the number of days it takes to convert working capital(or raw materials) into cash (or finished goods). The fewer the days the better. Note that important elements such as operating income and expenses are not part of ratios
- Current ratio and quick ratio
- Current ratio is current Assets/ Current liabilities. It tells you how well the company can pay of short-term debt. 2 and higher is considered good. Because some short term assets are hard to sell the quick ratio only uses short term assets that are extremely liquid so the formula is (Cash+ Securities+ Receivables)/Current liability. This leaves out the inventory and is considered more accurate. Note you have to compare current ratios to a benchmark
- Cash flow from operations to short-term debt ratio
- Differs from the current ratio because it uses cash flow from operations instead of current assets. By doing this convertibility from assets to cash is avoided. This is a better indicator of cash available.
- Cash burn rate
- This is typically only used on companies with negative earnings. The ratio measures how long a company is able to fund projected cost without any further cash contribution from shareholders or creditors. The usefulness of the ratio depends on the ability to estimate future costs as well as revenues.
- Long-term liquidity risk
- There are a variety of ratios that measure a firm’s long-term liquidity risk. Long-term liquidity problems are often more challenging to solve than short term. Examples of long-term problems include expirations of a patent or increased competition on core markets, which deteriorates profit.
- Financial leverage and solvency ratio
- The financial leverage and the solvency ratio provide identical information about the long-term liquidity risk. High leverage and low solvent is bad. Note that market value is closer to the real value and both ratios should be compared to an industry benchmark
- Interest coverage ratio
- It’s a measure of a company’s ability to meet its net financial expenses. The higher the better.
- Cash flow from operations to debt ratio
- Measures the extent to which current cash flow from operations is sufficient to repay liabilities. High is good
- Capital expenditure ratio and Capital based on reinvestments
- This ratio shows proportions of capital expenditure a company is able to fund through its operations. A capital exp. Based on reinvestments removes the impact of growth in investments and shows to what extent a company is able to finance reinvestments from internally generated funds.
- Sustainable growth rate
- A company cannot grow faster than the sustainable growth rate if it wants to preserve its financial risk. So it’s the rate that the company can grow while containing the same financial risk. If it wants more growth than that it has to take more risk. The company may affect the sustainable growth rate in three ways. 1. Operating profitability by improving performance 2. Financial leverage by enhancing earnings from debt capital 3. Dividend policies by reducing the payout ratio
- Is growth sustainable?
- Evidence supports that sales growth converges towards a long-term average after four to five years.
- Measuring growth
- But what measure of performance gives us the best idea of value creation is EVA. Sales, revenue, EBIT can all grow without actual value creation or profit ever occurring. The same goes for the other measure mentioned. Therefor EVA is the best measure especially because it takes account for the risk as well. An even better measure than EVA is to look at changes in EVA’s between periods The definition of a company in growth is a company that grows its EVA. The EVA will tell us of the company is profitable. There are two products that have shown the ability to sustain growth in EVA for a long period of time and that is Coke Cola and Gillette razors. Both fast consumer goods.
- Kafli 7 (Liquidity risk analysis)
- Measuring profitability
- Monitoring a firm’s profitability is a key issue in financial statement analysis. The profitability analysis involves looking at key ratios that describe different aspects of a firm’s profitability.
- Financial Ratios
- Financial ratio analysis can measure profitability, growth and risk for a company. They are indicators to the financial health of a company. We like to compare these ratios with three categories. 1. Time series analysis. (Multiple periods) Use historical date and trends input into forecasting 2. Cross-sectional analysis. (Across firms within the same industry) Measure performance within a certain industry 3. Rate of return (WACC, ROIC)
- Time series analysis
- 1. Time series analysis. (Multiple periods) Use historical date and trends input into forecasting
- Cross sectional analysis
- 2. Cross-sectional analysis. (Across firms within the same industry) Measure performance within a certain industry ·An alternative assessment of level of return on invested capital is called cross sectional analysis. Then you compare return on invested capital between two rival companies (Carlsberg vs. Heineken)
- Rate of return
- The key financial ratios of operating profitability are ROIC, WACC, PM and ATO.
- EVA
- Is an estimate of a firm's economic profit – being the value created in excess of the required return of the company's investors (being shareholders and debt holders). Quite simply, EVA is the profit earned by the firm, minus the cost of financing the firm's capital. EVA is associated with super profit or above normal profit.
- ROIC
- The ratio express the return on capital invested in a firms net operating assets as a percentage. This ratio reflects how well the company is using its money in investments and how much those investments generate returns
- ATO
- Expresses a company’s ability to utilize invested capital. A turnover rate of 2 says that the firm has tied up invested capital 180 days a year. By having capital tied up for too long you can destroy value, and the opposite by tying up money for a short period of time you can create value.
- PM
- Are expressed as a percentage and, in effect, measure how much out of every dollar of sales a company actually keeps in earning. A 20% profit margin, then, means the company has a net income of $0.20 for each dollar of total revenue earned
- WACC
- A company finances its assets either through debt or with equity. WACC is the average of the costs of these types of financing. By taking a weighted average in this way, we can determine how much interest a company owes for each dollar it finances. So in short, it is the rate that a company is expected to pay on average to all its security holders to finance its assets and operations.
- Kafli 6 (Growth analysis)
- Financial statement
- Decision making
- Use financial analysis for forecasting, valuation, cost of capital, credit analysis and accounting based bonus plans
- Kafli 8 (Forecasting)
- Kafli 9 (Valuation)
- Kafli 10 (Cost of capital)
- Kafli 11 (Credit analysis)
- Kafli 12 (Accounting based bouns plans for executives)
- Kafli 11 (Credit analysis)
- Kafli 10 (Cost of capital)
- Kafli 9 (Valuation)
- Assessment of accounting data
- Challenge the accounting data because manager have some flexibility in reporting
Images and files in the map
Information
- Description
- Financial Accounting Mind Map on Financial Statement analysis, created by Сергей Вологжанин on 15/12/2016.
- Created by
- Сергей Вологжанин
- Views
- 0
- History
-
- Created by Ævar Ólafsson · Sep 3, 2015
- Copied by Сергей Вологжанин · Dec 15, 2016
- Rating