
Mind map
Interpretation of Statistics
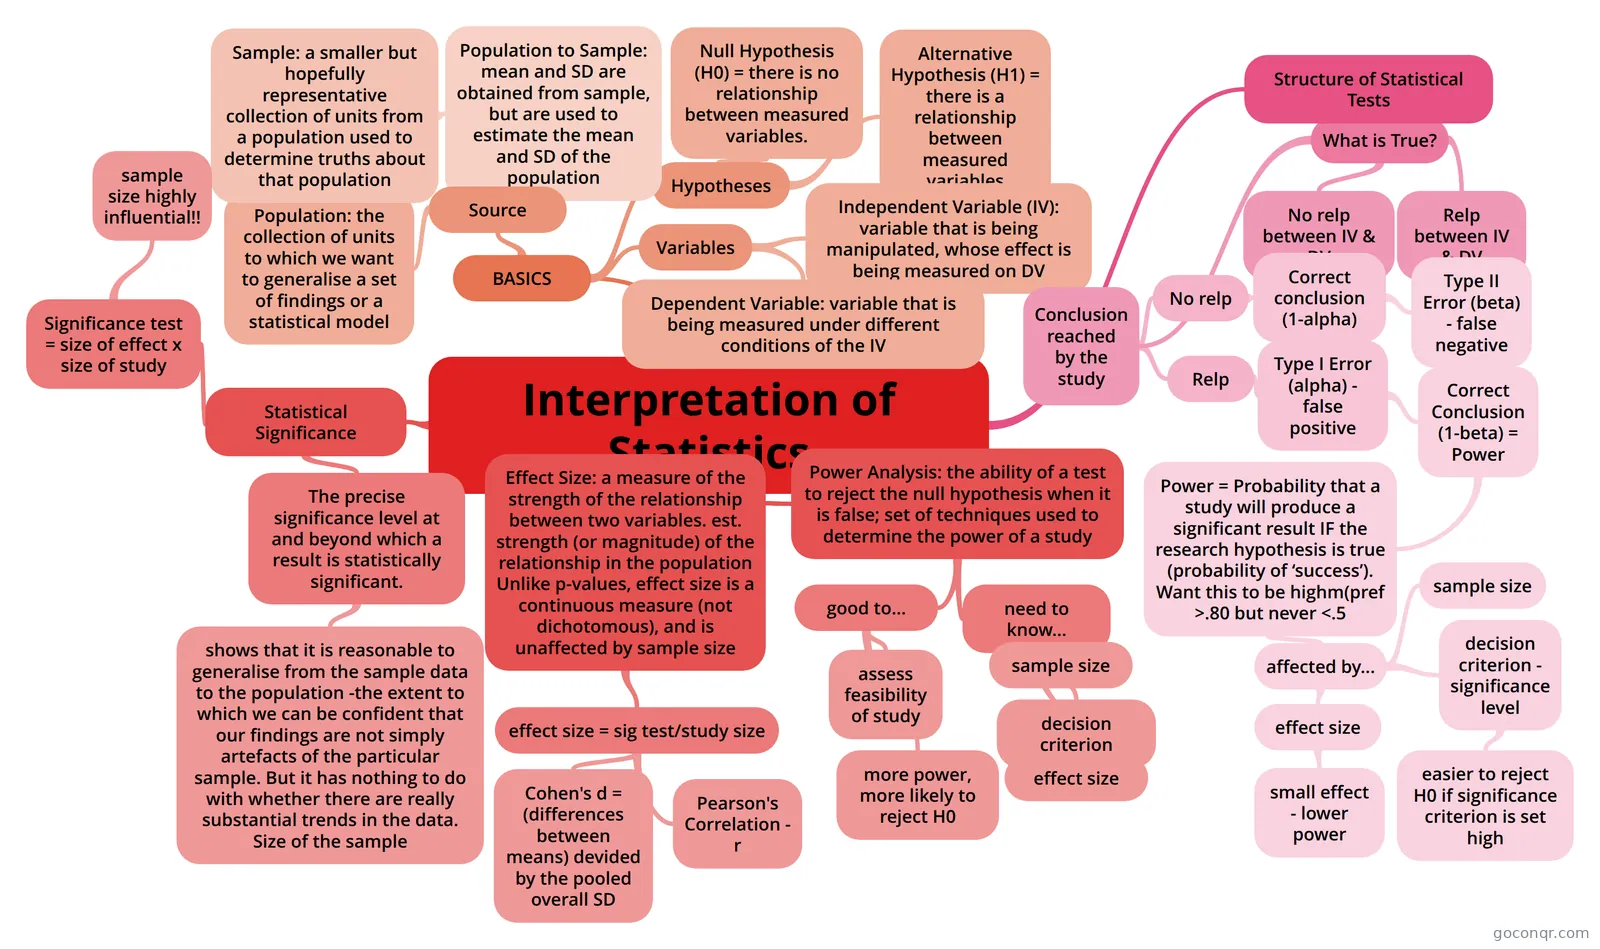
Mind map: Interpretation of statistics
Map content
Interpretation of Statistics
Statistical Significance
- The precise significance level at and beyond which a result is statistically significant.
- shows that it is reasonable to generalise from the sample data to the population -the extent to which we can be confident that our findings are not simply artefacts of the particular sample. But it has nothing to do with whether there are really substantial trends in the data. Size of the sample
- Significance test = size of effect x size of study
- sample size highly influential!!
- The precise significance level at and beyond which a result is statistically significant.
Effect Size: a measure of the strength of the relationship between two variables. est. strength (or magnitude) of the relationship in the population Unlike p-values, effect size is a continuous measure (not dichotomous), and is unaffected by sample size
- effect size = sig test/study size
- Cohen's d = (differences between means) devided by the pooled overall SD
- Pearson's Correlation - r
- effect size = sig test/study size
BASICS
- Hypotheses
- Null Hypothesis (H0) = there is no relationship between measured variables.
- Alternative Hypothesis (H1) = there is a relationship between measured variables
- Variables
- Independent Variable (IV): variable that is being manipulated, whose effect is being measured on DV
- Dependent Variable: variable that is being measured under different conditions of the IV
- Source
- Population: the collection of units to which we want to generalise a set of findings or a statistical model
- Sample: a smaller but hopefully representative collection of units from a population used to determine truths about that population
- Population to Sample: mean and SD are obtained from sample, but are used to estimate the mean and SD of the population
- Sample: a smaller but hopefully representative collection of units from a population used to determine truths about that population
- Population: the collection of units to which we want to generalise a set of findings or a statistical model
- Hypotheses
Structure of Statistical Tests
- What is True?
- Conclusion reached by the study
- No relp
- Correct conclusion (1-alpha)
- Type II Error (beta) - false negative
- Correct conclusion (1-alpha)
- Relp
- Type I Error (alpha) - false positive
- Correct Conclusion (1-beta) = Power
- Power = Probability that a study will produce a significant result IF the research hypothesis is true (probability of ‘success’). Want this to be highm(pref >.80 but never <.5
- affected by...
- sample size
- effect size
- small effect - lower power
- decision criterion - significance level
- easier to reject H0 if significance criterion is set high
- affected by...
- Power = Probability that a study will produce a significant result IF the research hypothesis is true (probability of ‘success’). Want this to be highm(pref >.80 but never <.5
- Correct Conclusion (1-beta) = Power
- Type I Error (alpha) - false positive
- No relp
- No relp between IV & DV
- Relp between IV & DV
- Conclusion reached by the study
- What is True?
Power Analysis: the ability of a test to reject the null hypothesis when it is false; set of techniques used to determine the power of a study
- need to know...
- sample size
- decision criterion
- effect size
- good to...
- assess feasibility of study
- more power, more likely to reject H0
- need to know...
Information
- Description
- Psych 3 exam prep Mind Map on Interpretation of Statistics, created by nita.b on 06/05/2013.
- Created by
- nita.b
- Views
- 148
- Tags
- Rating