
Mind map
Glycogen Metabolism
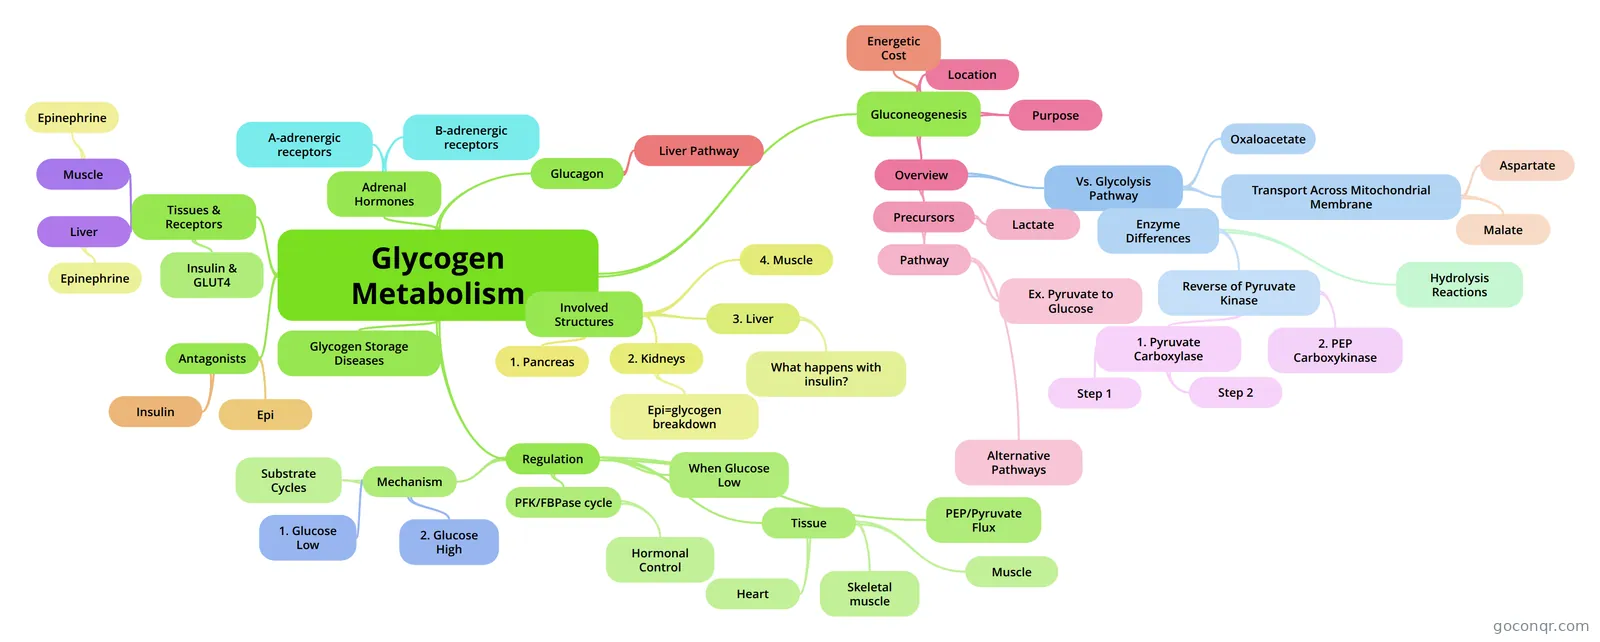
Mind map: Glycogen metabolism
Map content
Glycogen Metabolism
Glucagon
- 1. Critical for liver supplying glucose to tissues depending primarily on glycogen for energy needs 2. Released during exercise or between meals. [glucose] < 5mM
- Liver Pathway
- 1. Glucagon binds, generates intracellular cAMP, glucose mobilization from glycogoen
Tissues & Receptors
- Muscle
- 1. No glucagon receptor; only insulin 2. Beta adrenergic receptor 3. GLUT4 transporter
- Epinephrine
- 1. Breaks down glycogen for glycolysis, generating ATP, helps muscle cells cope with stress
- Liver
- 1. Alpha-adrenergic receptor 2. Beta-adrenergic receptor 3. Glucaogon receptor 4. Insulin receptor 5. GLUT2 glucose transporter
- Epinephrine
- 1. Responds directly & indirectly 2. Glucagon binds to liver cell stimulating glycogen breakdown
- Insulin & GLUT4
- 1. Both insulin & insulin senstitive GLUT4: Muscle&fat 2. Do not have both: liver& brain 3. With [insulin] increasing, [cAMP] decreases. Causes glycogen metabolic shift from breakdown to synthesis
- Muscle
Adrenal Hormones
- 1. Located in kidney adrenal glands. Release epinephrine & norepinpehrine in response to stress
- A-adrenergic receptors
- 1. Calcium as second messenger 2. When epi binds: Stimulates [calcium+2] increase, reinforces cells response to cAMP
- 3. Glycogen synthase inactivated through phosphorylation catalyzed by several calcium dependent protein kinases
- B-adrenergic receptors
- 1. When Epi binds, Linked to adenylate cyclase system cAMP
Involved Structures
- 1. Pancreas
- 1. Responsible for the release of glucagon from alpha cells in response to low blood glucose level 2. Responsible for the release of insulin from beta cells in response to high blood glucose level
- 2. Kidneys
- 1. Release of Epi & norepinephrine from adrenal glands
- Epi=glycogen breakdown
- 3. Liver
- 1. Respond to epinephrine directly and indirectly 2. Epinpehrine binds to Alpha and Beta adrenergic receptors in the liver
- 3. Results in 2nd release of cAMP and leads to glycogen breakdown
- What happens with insulin?
- 1. Insulin promotes glycogen synthesis 2. Glucose inhibits phosphorylase a by binding to inactive T state (R --> T shift). 3. Conformational shift promotes dephosphorylation
- 4. Inactivation of glycogen phosphorylase a through conversion to b form
- 4. Muscle
- 1. Pancreas
Glycogen Storage Diseases
- 1. Can affect liver (hepatomegaly) and hypoglycemia (low blood sugar) 2. May cause cardiovascular and renal disturbances
Antagonists
- Insulin
- Epi
Gluconeogenesis
- Purpose
- 1. Glucose unavailable through glycogen breakdown or dietary sources 2. Glucose synthesized from noncarb precursors
- Overview
- Vs. Glycolysis Pathway
- Enzyme Differences
- 1. Starting with pyruvate, mostly reversals of the steps of glycolysis 2. Either glycolysis or gluconeogenesis predominates depending on physiologic conditions
- Reverse of Pyruvate Kinase
- 1. Pyruvate --> oxaloacetate --> PEP 2. Pyruvate Carboxylase: Catalyzes ATP driven conversion of pyruvate & HCO3- to oxaloacetate (exergonic) 3. PEP carboxykinase: Converts oxaloacetate to PEP Uses GTP as phosphoryl-group donor
- 1. Pyruvate Carboxylase
- 1. Tetrameric protein of identical subunits. Biotin prosthetic group on each. Biotin is CO2 carrier
- Step 1
- 1. Cleave ATP--> ADP. Dehydrate bicarbonate via formation of "high energy" carboxyphosphate intermediate 2. Carboxyl group activate + transfer
- Step 2
- 1. Activated carboxyl group transferred from carboxybiotin to pyruvate in 3 step process forming oxaloacetate 2. 2 steps occur on different subsites of same enzme. 3. 14A long arm Lys-biotin transfers biotin ring between subsites
- 2. PEP Carboxykinase
- 1. GTP-requiring enzyme for decarboxylation & phosphorylation of oxaloacetate to PEP 2. Can be considered "activated" pyruvate with CO2 3. Biotin facilitating the activation at expense of ATP
- 1. Pyruvate --> Oxaloacetate occurs in mitochondrial while enzymes converting PEP to glucose are cytosolic
- Hydrolysis Reactions
- 1. FBP to F6P catalyzed by fructose-1,6-bisphosphatase (FBPase) 2. G6P to glucose catalyzed by glucose-6-phosphatase (G6Pase)
- 3. Both FBPase and G6Pase release phosphate rather than reversing ATP --> ADP
- Oxaloacetate
- 1. Oxaloacetate is both: gluconeogenesis intermediate & TCA intermediate 2. TCA metabolite [acetyl-coA] increases. Allosterically activates pyruvate carboxylase, enhances gluconeogenesis, increase amt available to combine with acetyl coA for TCA cycle
- Transport Across Mitochondrial Membrane
- 1. PEP can be transported across membrane by specific membrane transport proteins
- 2. All reactions freely reversible so transport system can be used to transport reducing equivalents into mitochondria for oxidative phosphorylation
- Aspartate
- Malate
- 1. Difference between 2 routes is that malate dehydrogenase route moves reducing equivalents from mitochondrial to cytosol (malate dehydrogenase) 2. Uses mitochondiral NADH, produces cytosol NADH
- 3. Gluconeogenesis requires NADH. Under most conditions, malate route necessity
- Enzyme Differences
- Precursors
- 1. Glycolysis products, lactate, pyruvate, TCA cycle intermediates, carbon skeleton of most amino acids
- Pathway
- 1. All substances converted to oxaloacetate which is a TCA metabolite 2. Not converted: Leucine, lysine, & fatty acids bc converted to acetyl coA
- Ex. Pyruvate to Glucose
- Alternative Pathways
- 1. Pentose Phosphate Pathway for R5P production 2. G6P converted to G1P for glycogen
- Lactate
- 1. Its oxidation to pyruvate generates cytosolic NADH and either transport can be used
- Vs. Glycolysis Pathway
- Location
- 1. Liver under fasting conditions
- 2. Either oxaloacetate must leave mitochondria for conversion to PEP 3. PEP formed in mitochondria must enter cytosol
- Energetic Cost
- 1. 6ATP equivalents. 2 from pyruvate carboxylase, 2 each in PEP carboxykinase, 2 each in phosphoglycerate kinase (3PG to 1,3PG)
- 1. Glycolysis net production is 2ATP, gluconeogenesis net cost is 6 ATP 2. Net energy loss by cycling glucose to pyruvate and back, 4ATP, thermodynamic cost to maintain independent regulation of 2 opposing pathways
- Purpose
Regulation
- PFK/FBPase cycle
- [F2,6P] determined by: Rate of synthesis by phosphofructokinase-2 (PFK-2) & Rate of degradation by fructose bisphosphatase-2 (FBPase-2)
- Enzyme activities located on diff. domains of same 100kD homodimeric protein
- Hormonal Control
- 1. Bifunctional enzyme regulated by allosteric effectors, covalent modification (phosphorylatoin, dephosphorylation) controlled by PKA and a phosphoprotein phosphatase
- Mechanism
- 1. Glucose Low
- Glucagon stimulates [cAMP] in liver cells. Activates PKA to phosphorylate the bifunctional enzyme FBPase-2/PKA-2. Deactiavtes PFK-2 activity and activates FBPase-2. Leads to decreased [F2,6P] & favors FBP hydrolysis. Increases gluconeogenesis flux and glycogen breakdown in liver.
- 2. Glucose High
- Substrate Cycles
- 3 substrate cycles & 3 regulatory points
- 1. Glucose Low
- When Glucose Low
- Tissue
- Heart
- Hormones stimulating glycogen breakdown such as epinephrine. Phosphorylatoin of a site on a bifunctional enzyme. Activates PFK-2, increase [F2,6P], stimulates glycolysis which is coordinated with glycogen
- Skeletal muscle
- Isozyme lacks phosphorylation site. Not subject to epinephrine's cAMP dependent control
- Muscle
- 1. Gluconeogenesis does not occur. Diff. PFK-2/FBPase 2 isoenzymes
- Heart
- PEP/Pyruvate Flux
- 1. Acetyl-CoA activates pyruvate carboxylase. 2. No known allosteric effectors of PEP carboxykinase (PEP) 3. Pyruvate kinase: Allosterically inhibited in liver by alanine. Alanin converted to pyruvate. 4. Liver pyruvate kinase: Inactivated by phosphorylation, further increasing gluconeogenic flux
- PFK/FBPase cycle
Information
- Description
- Mind Map on Glycogen Metabolism, created by kellygorrell on 26/04/2014.
- Created by
- kellygorrell
- Views
- 50
- Rating