Description
|
|
Created by alistairewart
over 10 years ago
|
|
|
|
Copied to Note by alistairewart
over 10 years ago
|
|
Page 1
Random Variables Continuous random variable **Discrete random variables** Methods for discribing The mean Variance of Discrete Random Variables µ = ∑xP(x) SD^2 = ∑(x - µ)^2 • P(x)
Definitions SSO Experiment Variable Trials Probability Distribution event of interest Coin Example
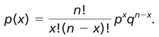
FormulasBinomial Formula
calling it that (p) (q) (x) (n) (X) Attached Study AidsMind Map - Discrete Probability Distributions
Probability Distribution TableSetting up
**Binomial random variables** Characteristics Binomial probability mass function 1) Identical Trials 2)Trials results (S) (F) 3) probability (p) is constant from trial to trial 4)The trials are independent Success Failure P(x) = nCx • px • (1-p)^(n-x) MU= N x P SD^2 = np(1 - p)
A random variable can be thought of as representing an uncertain numerical outcome of an experiment
variables can take any numerical value on the real number linetemperature of a cup of coffee served at mcdonald's restaurant.time in seconds that a customer in a store must wait to recieve a cred card autorizationany value is possible in a certain range
The trials are the exact same.
1-P
Sample Space Outcomes
Sucess
Failure
A Random non-determined experiment.
1)A description of a person/place/idea 2) This value can vary from one entity to another
Total number of successes in (n) trials
How many times you did the experiment
Number of trials
list of all possible outcomes of a RANDOM VARIABLE
flip a coin 3 times... Let A= the even of observing 1 heads in three flips.What is the P(A)?
The event of interest
is a list of all possible outcomes of a random variable and their corresponding probabilities
1) define the random variable x= event of interest2) create a table of outcomes with the two headings outcomes and value of X3) list all of the possible outcomes and the values of X that correspond to each4) create probability distribution table with three headings x, frequency, m, P(x)Remember to put totals at the end of the graph
Counting numbers like rolling dice or flipping a coin.
1) histograms, X and it's corresponding values in a probability table and a function.
The Average value of the random variable if we were to observe it for an indefinite period of time
n trials where the probability for a success for each trial is p, the probability of observing x successes is?
align_clippings_on_this_page_please
Chapter four
Annotations
Want to create your own Notes for free with GoConqr? Learn more.