Description
|
|
Created by Maxia Webb
over 9 years ago
|
|
Page 1
Definition of Basic Statistical Terms
N "n" is usually used to indicate the number of subjects in a study. Example: If you have 76 participants in a study, n=76.
Page 2
The Three M's: Mean, Median and Mode
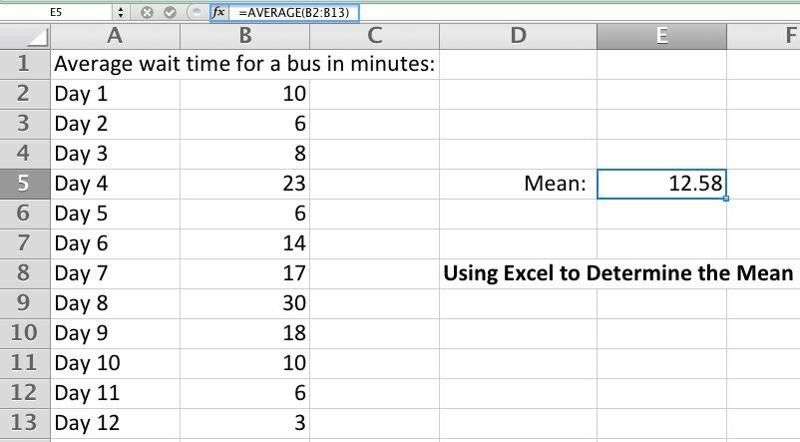
Mean The average result of a test, survey, or experiment. Example: Heights of five people: 5 feet 6 inches, 5 feet 7 inches, 5 feet 10 inches, 5 feet 8 inches, 5 feet 8 inches. The sum is: 339 inches. Divide 339 by 5 people = 67.8 inches or 5 feet 7.8 inches. The mean (average) is 5 feet 7.8 inches.
Page 3
Mean The average result of a test, survey, or experiment.
Page 4
The Three M's: Mean, Median and Mode
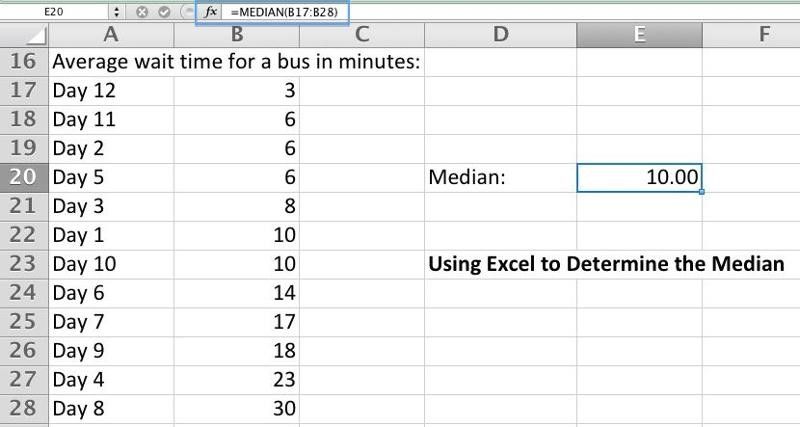
Median The score that divides the results in half - the middle value. Examples: Odd amount of numbers: Find the median of 5 feet 6 inches, 5 feet 7 inches, 5 feet 10 inches, 5 feet 8 inches, 5 feet 8 inches. Line up your numbers from smallest to largest: 5 feet 6 inches, 5 feet 7 inches, 5 feet 8 inches, 5 feet 8 inches, 5 feet 10 inches. The median is: 5 feet 8 inches (the number in the middle).Even amount of numbers: Find the median of 7, 2, 43, 16, 11, 5 Line up your numbers in order: 2, 5, 7, 11, 16, 43 Add the 2 middle numbers and divide by 2: 7 + 11 = 18 ÷ 2 = 9 The median is 9.
Page 5
Median The score that divides the results in half.
Page 6
The Three M's: Mean, Median and Mode
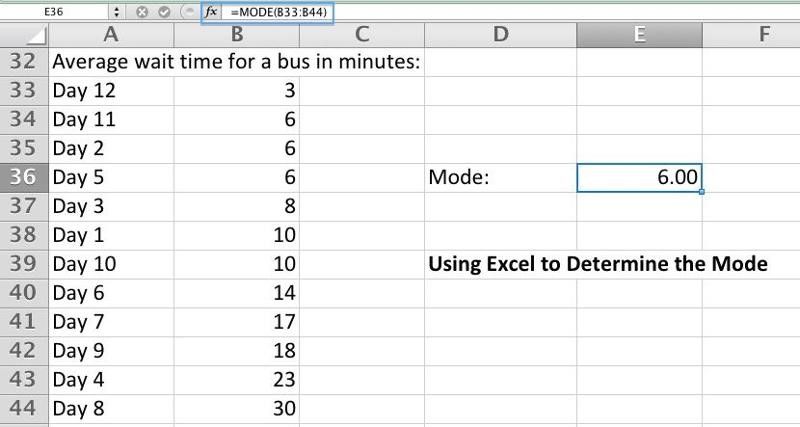
Mode The most common result (the most frequent value) of a test, survey, or experiment.Example: Find the mode of 5 feet 6 inches, 5 feet 7 inches, 5 feet 10 inches, 5 feet 8 inches, 5 feet 8 inches. Put the numbers is order to make it easier to visualize: 5 feet 6 inches, 5 feet 7 inches, 5 feet 8 inches, 5 feet 8 inches, 5 feet 10 inches. The mode is 5 feet 8 inches (it occurs the most, at 2 times).
Page 7
Mode The most common result of a test, survey, or experiment.
Page 8
Significant Difference
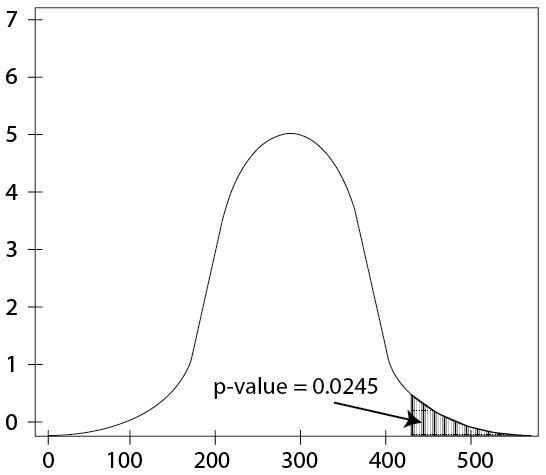
Significance The measure of whether the results of research were due to chance. The more statistical significance assigned to an observation, the less likely the observation occurred by chance. p-value The way in which significance is reported statistically (i.e. p<.01 means that there is a less than 1% chance that the results of a study are due to random chance). Note that generally p-values need to be fairly low (.01 and .05 are common) in order for a study to make any strong claims based on the results. Example: A study had one group of students (Group A) study using notes they took in class; the other group (Group B) studied using notes they took after class using a recording of the lecture. Students in Group A scored higher on a test than Group B. The study reports a significance of p<.01 for the results. This means that whatever the reason students who took notes in class did better on the test, there is only a 0 - 1% chance that the results are due to some random factor (such as Group A having smarter students than Group B).
Page 9
Significance The measure of whether the results of research were due to chance. p-value The way in which significance is reported statistically. For example, p<.01 means that there is a less than 1% chance that the results of a study are due to random chance.
Page 10
Correlation
Correlation The degree to which two factors appear to be related. Correlation should not be confused with causation. Just because two factors are reported as being correlated, you cannot say that one factor causes the other. For example, you might find a correlation between going to the library at least 40 times per semester and getting high scores on tests. However, you cannot say from these findings what about going to the library, or what about people who go to libraries often, is responsible for higher test scores. r-value The way in which correlation is reported statistically (a number between -1 and +1). Generally, r-values should be >+/-.3 in order to report a significant correlation. An r-value of -1 indicates a extreme negative correlation between two variables - as one variable's values tend to increase, the other variable's values tend to decrease. An r-value of +1 indicates an extreme positive correlation between two variables - as one variable's values tend to increase, the other variable's values also tend to increase. An r-value of 0 means there is no correlation at all between the elements being studied. http://tutorials.istudy.psu.edu/basicstatistics/#headingtaglink_1
Want to create your own Notes for free with GoConqr? Learn more.