Description
|
|
Created by Sarah-Jean Edmonds
almost 9 years ago
|
|
Page 1
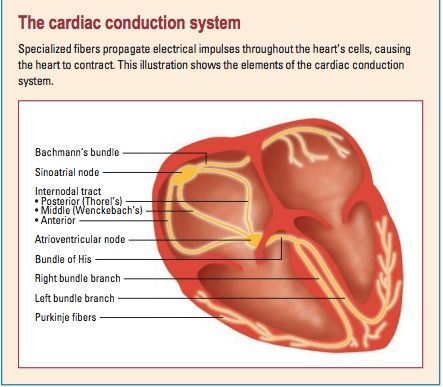
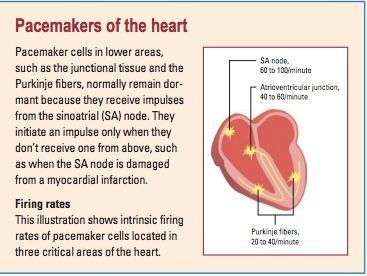
Important to know: Conduction starts at SA nods, to AV node, to bundle of His and Purkinje fibersSee below for firing rates in the even of damaged SA or AV nodes by myocardial infarction
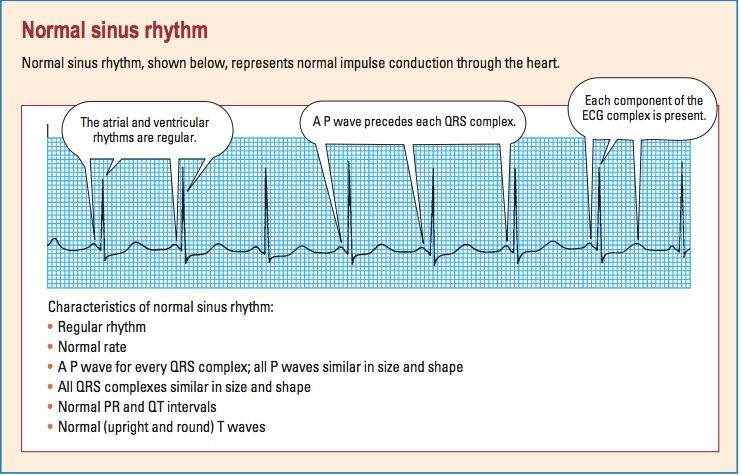
P wave: Atrial depolarization location—precedes the QRS complex amplitude—2 to 3 mm high duration—0.06 to 0.12 second configuration—usually rounded and upright Peaked, notched, or enlarged P waves may represent atrial hypertrophy or enlargement associated with chronic obstructive pulmonary disease, pulmonary emboli, valvular disease, or heart failure. Inverted P waves may signify retrograde or reverse conduction from the atrioventricular (AV) junction toward the atria. PR Interval: location—from the beginning of the P wave to the beginning of the QRS complex duration—0.12 to 0.20 second QRS Complex The QRS complex follows the P wave and represents depolarization of the ventricles. Immediately after the ventricles depolarize, as represented by the QRS complex, they contract. That contraction ejects blood from the ventricles and pumps it through the arteries, creating a pulse. location—follows the PR interval amplitude—5 to 30 mm high but differs for each lead used duration—0.06 to 0.10 second, or half of the PR interval. Duration is measured from the beginning of the Q wave to the end of the S wave or from the beginning of the R wave if the Q wave is absent ST Segment end of ventricular conduction or depolarization and the beginning of ventricular recovery or repolarization location—extends from the S wave to the beginning of the T wave deflection—usually isoelectric (neither positive nor negative); may vary from –0.5 to +1 mm in some precordial leads. ST-segment depression: An ST segment is considered depressed when it’s 0.5 mm or more below the baseline. A depressed ST segment may indicate myocardial ischemia or digoxin toxicity. ST-segment elevation: An ST segment is considered elevated when it’s 1 mm or more above the baseline. An elevated ST segment may indicate myocardial injury. T Wave ventricular recovery or repolarization. Duration is not measured location—follows the S wave amplitude—0.5 mm in leads I, II, and III and up to 10 mm in the precordial leads configuration—typically round and smooth QT Interval ventricular depolarization and repolarization. The length of the QT interval varies according to heart rate. The faster the heart rate, the shorter the QT interval. location—extends from the beginning of the QRS complex to the end of the T wave duration—varies according to age, sex, and heart rate; usually lasts from 0.36 to 0.44 second; shouldn’t be greater than half the distance between consecutive R waves when the rhythm is regular.
Steps for interpreting ECG
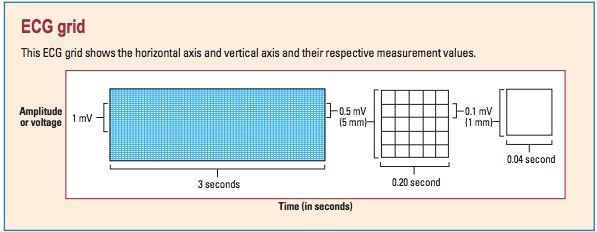
Determine rhythm: compare the distance between R-R intervals to determine is rhythm is regular or irregular Determine the rate: In a six second strip, multiply R peaks by 10. (60 secs in a minute; 15 large boxes in 3 seconds) Evaluate P wave: Are P waves present? Do they all have normal configurations? Do they all have a similar size and shape? Is there one P wave for every QRS complex? Duration of PR interval: To measure the PR interval, count the small squares between the start of the P wave and the start of the QRS complex; then multiply the number of squares by 0.04 second. Now ask yourself: Is the duration a normal 0.12 to 0.20 second? Is the PR interval constant? Determine duration of QRS complex: To calculate duration, count the number of small squares between the beginning and end of the QRS complex and multiply this number by 0.04 second. Then ask yourself: Is the duration a normal 0.06 to 0.10 second? Are all QRS complexes the same size and shape? (If not, measure each one and describe it individually.) Does a QRS complex appear after every P wave? Evaluate T waves: Are T waves present? Do they all have a normal shape? Do they all have a normal amplitude? Do they all have the same amplitude? Do the T waves have the same deflection as the QRS complexes? Determine duration of QT interval: Count the number of small squares between the beginning of the QRS complex and the end of the T wave, where the T wave returns to the baseline. Multiply this number by 0.04 second. Ask yourself: Is the duration a normal 0.36 to 0.44 second? Evaluate any other components: Check for ectopic beats and other abnormalities. Also check the ST segment for abnormalities, and look for the presence of a U wave. Note your findings, and then interpret them by naming the rhythm strip according to one or all of these findings: origin of the rhythm (for example, sinus node, atria, AV node, or ventricles) rate characteristics (for example, bradycardia or tachycardia) rhythm abnormalities (for example, flutter, fibrillation, heart block, escape rhythm, or other arrhythmias).
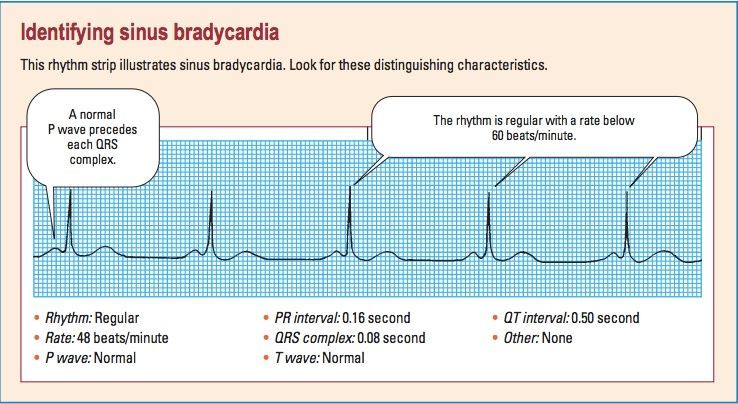
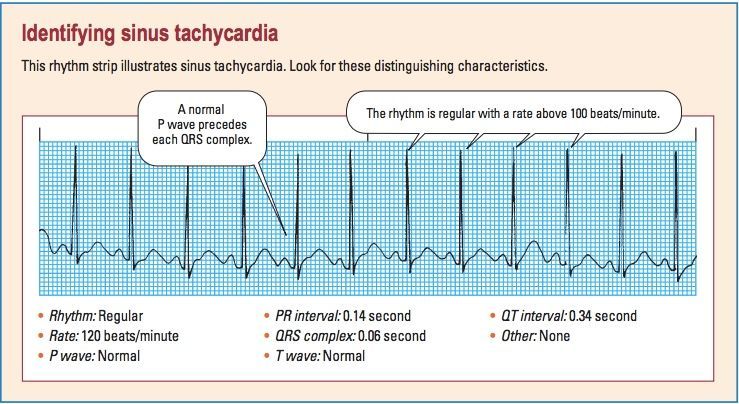
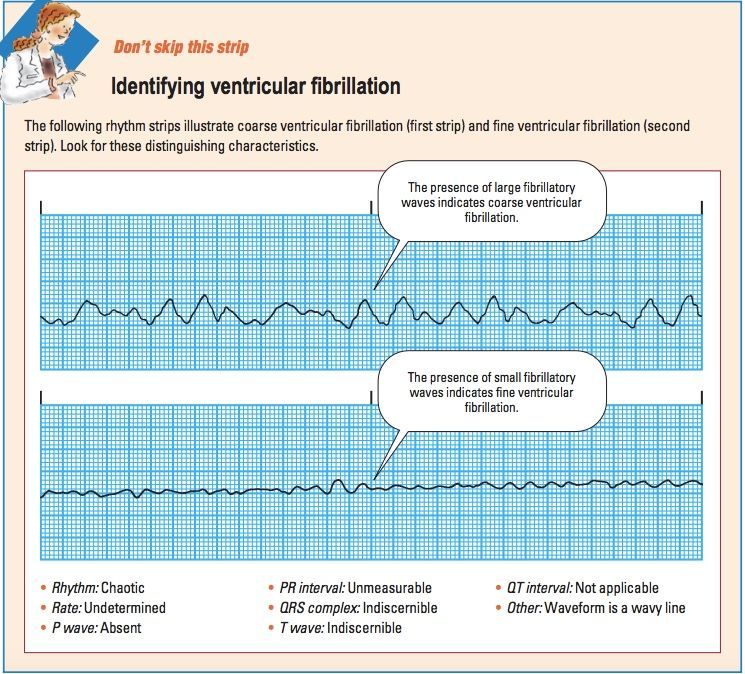
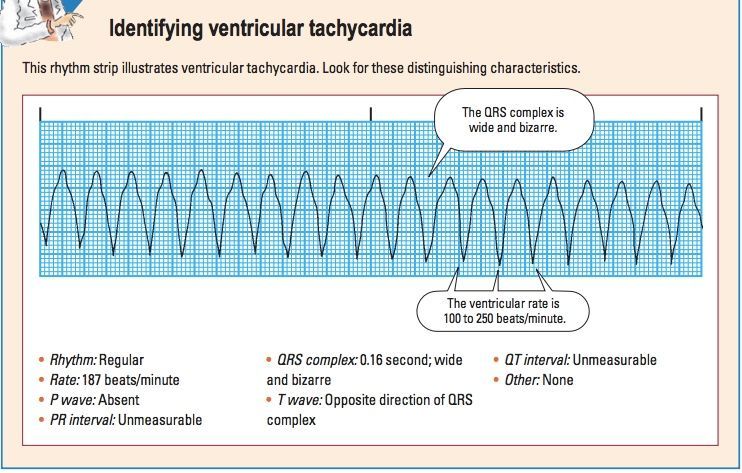
Recognizing Rhythms
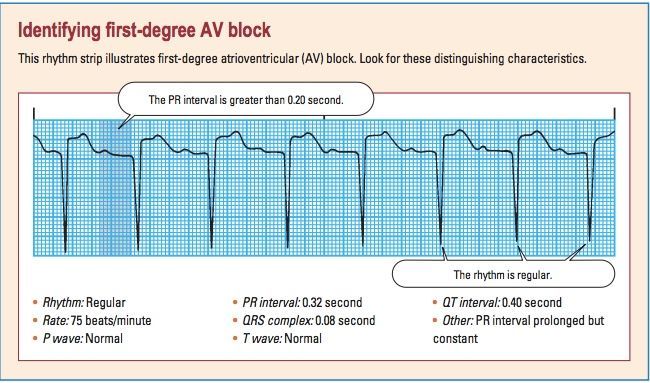
Sinus- extra factsSinus rhythm with first degree heart block: new heart blocks are common after MI; monitor for degrading to 2nd/3rd degree. 60-80bpm. Regular rhythm. Long PR. Normal QRS
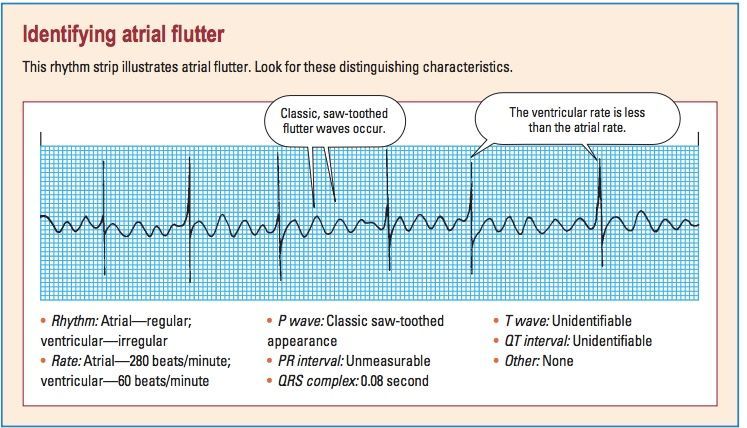
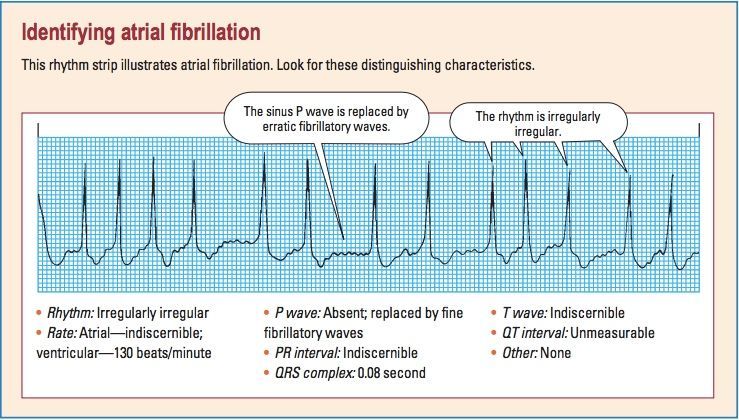
Atrial extra factsA-fib: BP will drop. Treatment is beta blockers, calcium channel blockers, anticoagulants (30% of blood volume is getting clotted in atriums, could result in stroke, clots, etc.)
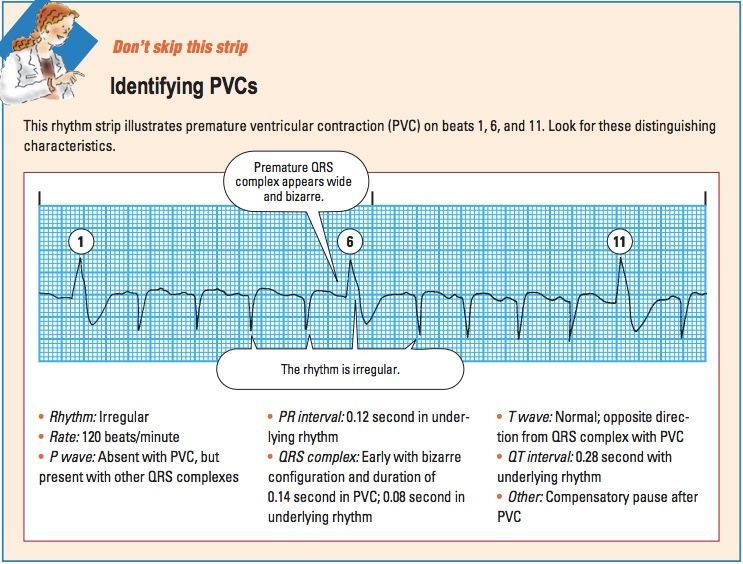
Deciphering PVCs To determine whether the rhythm you’re assessing is a premature ventricular contraction (PVC) or some other beat, ask yourself these questions: Are you seeing ventricular escape beats rather than PVCs? Escape beats act as a safety mechanism to protect the heart from ventricular standstill. The ventricular escape beat will be late, rather than premature. Are you seeing normal beats with aberrant ventricular conduction? Some supraventricular impulses may take an abnormal pathway through the ventricular conduction system, causing the QRS complex to appear abnormal. This aberrantly conducted beat will have a P wave, whereas a PVC doesn’t
Want to create your own Notes for free with GoConqr? Learn more.