Flashcards
Chapter 4: Measuring center and spread of a distribution
Flashcards do conjunto (22)
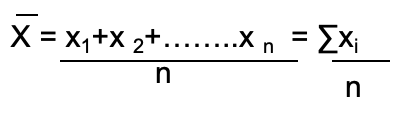
- 1Meanthe sum of all measurements divided by how many measurements there are
mean is not resistant to outliers - 2Population mean symbol

- 3Mediancuts the ordered data set into half
resistant to outliers
if n is odd, then L(M) is a whole number and is an observation
if n is even, then L(M) is a fraction and is the average of the ordered observations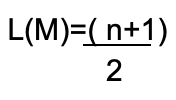
- 4Rangethe difference between the smallest and largest observations
not resistant to outliers
a measure of the overall spread
- 5Variancea measure of variability about the mean
- 6Population Variance

- 7Sample Variance
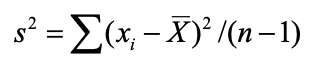
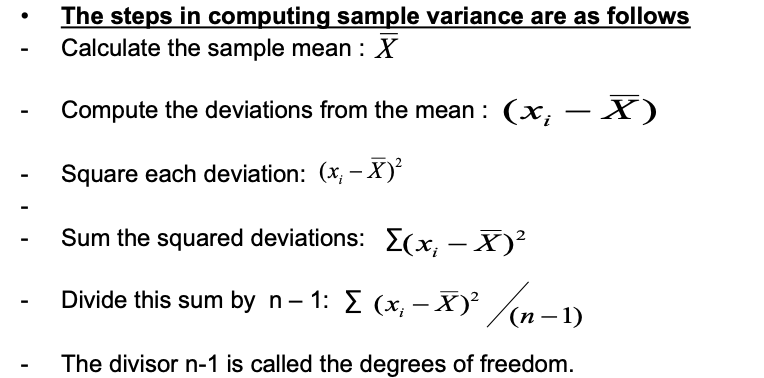
- 8Sample variance computation steps
- 9Standard Deviationthe difference between the data value and the mean
tells us how far things are away from the mean
it is the square root of the variance
- 10Interquartile Range (IQR)a measure of dispersion around the median
resistant to outliers
better measure of spread for skewed distributions
IQR - Q3 - Q1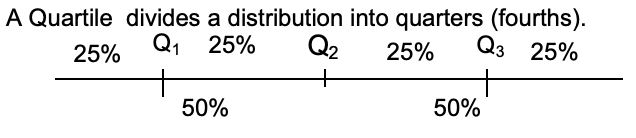
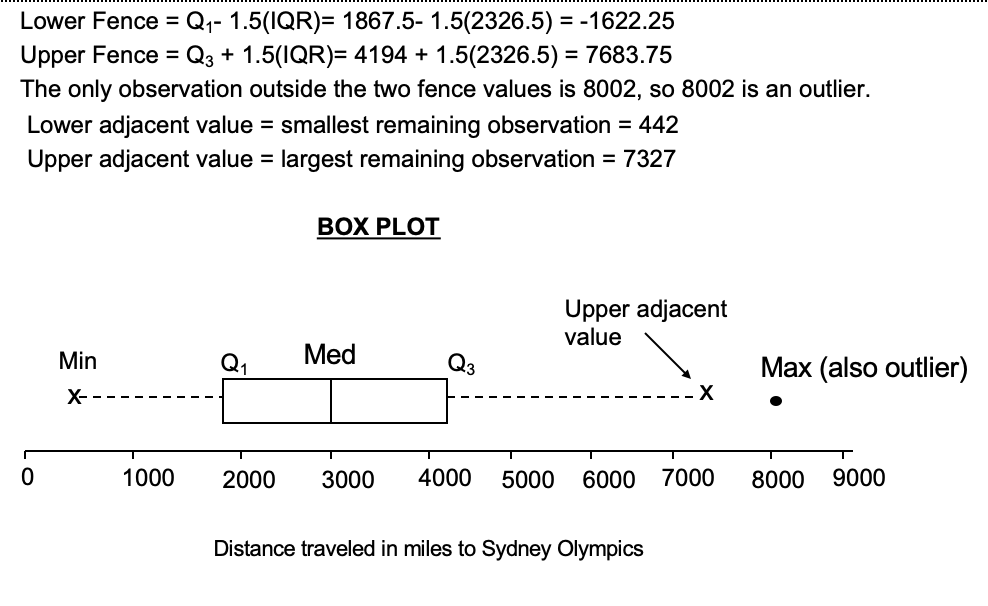
- 11Box Plotsa graphical display which uses several of the numerical measures to give information on symmetry, skewness, spread, outliers
5 number summary - 12Box Plot construction
- 13Independent/explanatory variable (X)the measurement variable that has no restraints placed on it and that attempts to explain the observed outcomes of another variable
- ex. time spent to study for an exam - 14Dependent/response variable (Y)the measurement variable that measures an outcome of a process that is the effect or consequence of the independent variable
ex. exam scores - 15Scatterplotused to describe the relationship between the independent and dependent variables
description includes specifying the direction, form, and strength of relationship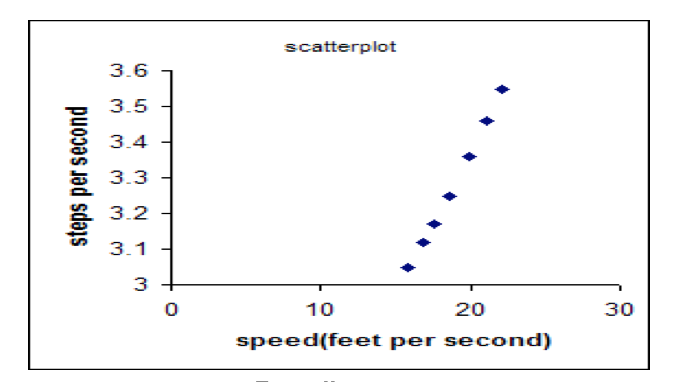
- 16Positive Associationif small values of X are associated with small values of Y and large values of X are associated with large values of Y
the trend in a scatterplot will be upward sloping - 17Negative Associationif small values of X are associated with large values of Y and vice versa
the trend in a scatterplot will be downward sloping - 18Directiondetermines the type of association between X and Y
upward/downward sloping - 19Formdescribes the type of trend in the data
- 20TrendLinear (straight line)
Nonlinear (exponential, quadratic) - 21Strengthmeasures the amount of scatter of a relationship
more scatter = weaker relationship
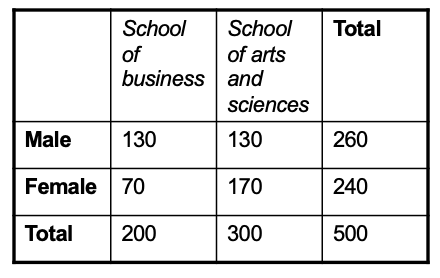
less scatter = stronger relationship - 22Contingency Tablesa two way table which describes the relation between two categorical variables
data from table can be represented in a bar graph