
Mapa mental
Statistics
Conteúdo do mapa
Statistics
Chapter one
- Branches of statistics
- Descriptive statistics: branch of statistics that involves the organization, summarization, and display of data Inferential statistics: branch of statistics that involvesusing a sample to draw conclusions about a population.
- Types of data and levels of measurements
- Qualitative data: consists of attributes, labels, or non-numerical entries Quantitative data: consists of numerical measurements orcounts Nominal: qualitative only, data at this level arecategorized using names, labels, or qualities Ordinal: qualitative or quantitative, data at this level canbe arranged in order but differences between data entries are not meaningful Interval: quantitative only, can be ordered, and meaningfuldifferences between data entries can be calculated. In this level, a zero entrysimply represents a position on a scale, it is not an inherent zero. Ratio: Similar to the interval level, with the addedproperty that a zero entry is an inherent zero.
- Data collection
- Observational study: a researcher observes and measures characteristics of interest of part of a population but does not change existing conditions. Experiment: a treatment is applied to part of a populationand responses are observed. Another part of the population can be used as a controlgroup, in which no treatment is applied. Sometimes, the experimental units aregiven a placebo, which is a harmless, unmedicated treatment, that is made tolook like a real treatment. Simulation: the use of a mathematical or physical model toreproduce the conditions of a situation or process. Survey: an investigation of one or more characteristics of apopulation.
- Experimental design
- Confounding variable: occurs when an experimenter cannot tell the difference between the effects of different factors on a variable. Placebo effect: when a subject reacts favorably to a placebo when in fact the subject has been given no medicated treatment at all. Blinding: technique where the subjects do not know whether they are receiving a treatment or a placebo. Double-blind experiment: neither the experimenter nor the subjects know if the subjects are receiving a treatment or a placebo. Randomization: a process of randomly assigning subjects to different treatment groups. Completely randomized design: subjects are assigned to different treatment groups through random selection. Blocks: groups of subjects with similar characteristics. Randomized block design: divide subjects with similar characteristics into blocks, then, within each block, randomly assign subjects to treatment groups. Matched-pairs design: subjects are paired up according to a similarity. Sample size: the number of subjects. Replication: the repetition of an experiment under the same or similar conditions.
- Sampling Techniques
- Census: a count or measure of an entire population. Sampling: account or measure of part of a population, and it is more commonly used. Sampling error: the difference between the results of a sample and those of the population. Random sample: one in which every member of the population has an equal chance of being selected. Simple random sample: a sample in which every possible sample of the same size has the same chance of being selected. Biased sample: one that is not representative of the population from which it is drawn. Stratified sample: members of the population are divided into two or more subsets that share a similar characteristic such as age, gender, ethnicity or even political preference. Cluster sample: divide the population into clusters and select all of the members in one or more of the clusters. Systematic sample: sample in which each member of the population assigned a number so that they are ordered at regular intervals. Convenience sample: leads to biased studies, and it consists only of available members of the population.
- Branches of statistics
Chapter 2
- Frequency distributions
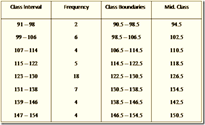
- Frequency distribution: a table that shows classes or intervals of data entries with a count of the number of entries in each class. Frequency: number of data entries in each class. Lower class limit: the least number that can belong to the class. Upper class limit: the greatest number that can belong to the class. Class width: the distance between lower and upper limits of consecutive classes. Range: the difference between the max and min data entries. Midpoint: the sum of the lower and upper limits of the class divided by two. Relative frequency: the percentage of the data that falls in that class. Cumulative frequency: the sum of the frequencies of that class and all previous classes.
- Graphs of frequency distributions
- Frequency histogram: a bar graph that represents the frequency distribution of a data set. Class boundaries: the numbers that separate classes without forming gaps between them. Relative frequency histogram: same shape and horizontal scale as the frequency histogram, only that the vertical scale measures the relative frequencies. Ogive: line graph that displays the cumulative frequency of each class at its upper class boundary.
- Quantitative, qualitative, and paired data sets
- Stem-and-leaf plot: each number is separated into a stem and a leaf. Pie chart: a circle that is divided into sectors that represent categories. Pareto chart: vertical bar graph in which the height of each bar represents frequency or relative frequency. Paired data sets: when each entry in one data set corresponds to one entry in a second data set. Scatter plot: the ordered pairs are graphed as points in a coordinate plane.
- Measure of central tendency
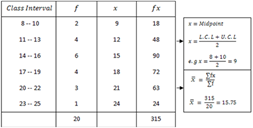
- Mean: the sum of the data entries divided by the number of entries. Median: the value that lies in the middle of the data when the data set is ordered. Mode: the data entry that occurs with the greatest frequency. Outlier: data entry that is far removed from the other entries in the data set.
- Weighted mean
- Shapes of distributions
- Symmetric: when a vertical line can be drawn through the middle of a graph of the distribution and the resulting halves are approximately mirror images. Uniform: when all entries in the distribution have equal or approximately equal frequencies. Skewed left: negatively skewed, and its tail extends to the left. Skewed right: positively skewed, and its tail extends to the right.
- Deviation, variance, and standard variation
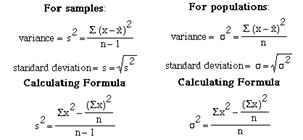
- Deviation: the difference between the entry and the mean of a data set. Population variance: the mean of the squares of the deviation. Population standard variation: square root of the population variance.
- Quartiles and the z-score
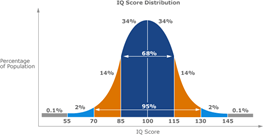
- Quartiles: Q1, Q2, Q3, approximately divide an ordered data set into four equal parts. Interquartile range: measure of variation that gives the range of the middle 50% of the data.Box-and- whisker plot: exploratory data analysis tool that highlights the important features of adata set. Z-score: represents the number of standard deviations a given value x falls from the mean u.
- Frequency distributions
Chapter 3
- Probability experiments
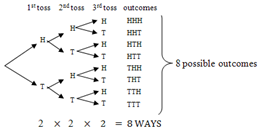
- Probability experiment: a trial through which specific results are obtained. Outcome: the result of a single trial in a probability experiment. Sample space: the set of all possible outcomes of a probability experiment. Event: a subset of the sample space Tree diagram: gives a visual display of the outcomes of a probability experiment by using branches that originate from a starting point. Simple event: an event that consists of a single outcome.
- The fundamental counting principle
- Types of probability
- Classical (theoretical): used when each outcome in a sample space is equally likely to occur. Empirical (statistical): based on observations obtained from probability experiments. Conditional probability: probability of an event occurring given that another event has already occurred.
- Independent and dependent events
- Independent: occurrence of one of the events does not affect the probability of the occurrence of the other event. Dependent: events that are not independent. Mutually exclusive: when two events cannot occur at the sametime.
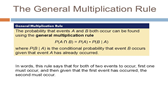
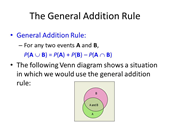
- The multiplication and addition rule
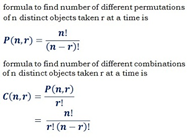
- Permuations and combinations
- Permutation: an ordered arrangement of objects. Distinguishable permutations: of n objects, where n1 are of one type, n2 are of another type.
- Probability experiments
Chapter 4
- Random variables
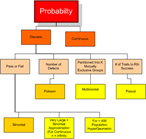
- Random variable: x represents a numerical value associated with each outcome of a probability experiment. Discrete: if it has a finite or countable number of possible outcomes that can be listed. Continuous: if it has an uncountable number of possible outcomes, represented by an interval of the number line.
- Discrete probability distributions
- Discrete probability distribution: lists each possible value the random variable can assume, together with its probability.
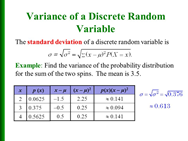
- Mean, Variance, and standard deviation
- Expected value: of a discrete random variable is equal to the mean of the random variable.
- Binomial experiments
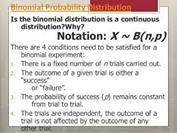
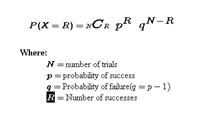
- n: the number of times a trial is repeated. P: the probability of success in a single trial. q: the probability of failure of a single trial (q= 1-p) x: the random variable represents a count of the number of successes in n trials: x= 0, 1, 2, 3,…n.
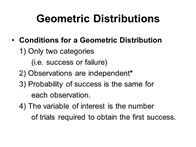
- The geometric distribution
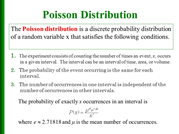
- The poisson distribution
- Random variables
Imagens e arquivos do mapa
Informações
- Descrição
- Mapa Mental sobre Statistics, criado por Gaby Fuentes em 08-05-2018.
- Criado por
- Gaby Fuentes
- Visualizações
- 5
- Avaliação