
Mapa mental
harder graphs
Conteúdo do mapa
harder graphs
circle graphs with a centre of 0,0, the equation for the circle and radius is x² + y² = r²
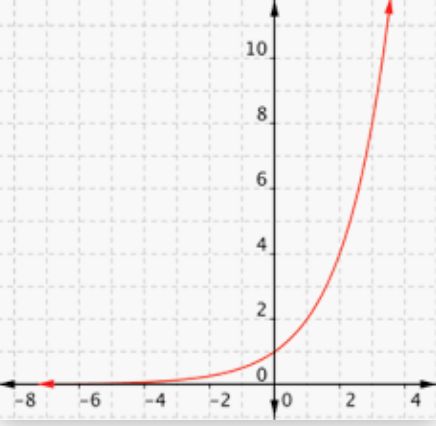
k*x graphs, also seen as y = k*x, or y = k*-x (k being a positive number), are exponential graphs, always above the x axis, and go through the point (0,1). if k>1 and the power is positive, the graph curves upwards, if k is between 0 and 1, or the power is negative, the te graph curves backwards
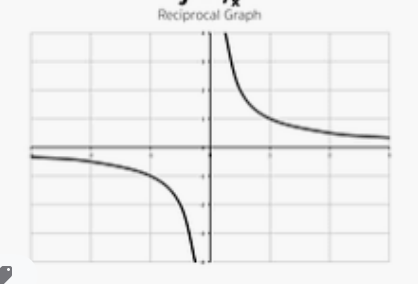
recriprocal graphs are y = A/x or xy = A. they are the same basic shape as exponential, but the negative ones are in opposite quadrants. the two halves never touch, and they don't exist for x=0. they're all symmetrical about the lines y = x and y = -x
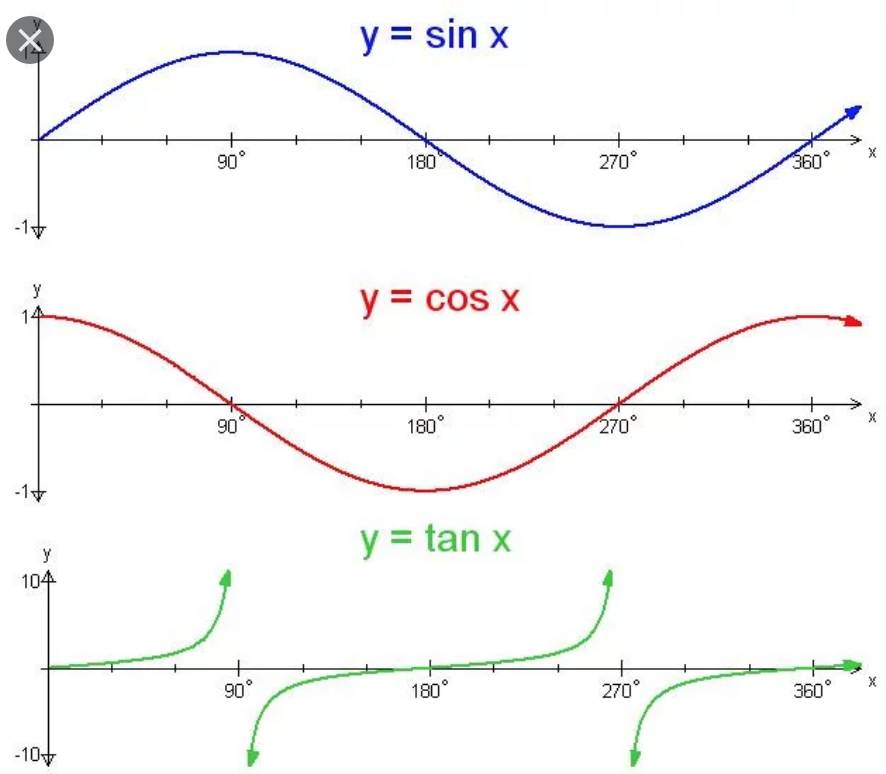
there are sine waves and cos 'buckets'. the underlying shape is the same, they both bounce between 1 and -1. the difference is that the sin graph is shifter right by 90, compared to the cos graph. from 0 to 360, you get one full period of the wave ( one peak and one trough), the graphs repeat every 360. the equations for the are y = sin x and y = cos x.
y = tan x is very different. it repeats every 180, and it goes from - infinity to + infinity every time. tan x is undefined at +/- 90, and +/- 270
Imagens e arquivos do mapa
Informações
- Descrição
- GCSE Maths (Graphs) Mapa Mental sobre harder graphs, criado por lizabeth rawson em 01-03-2020.
- Criado por
- lizabeth rawson
- Visualizações
- 0
- Avaliação