5663231
Descrição
Mapa Mental por Akasha Corion, atualizado more than 1 year ago
|
|
Criado por Akasha Corion
mais de 9 anos atrás
|
|
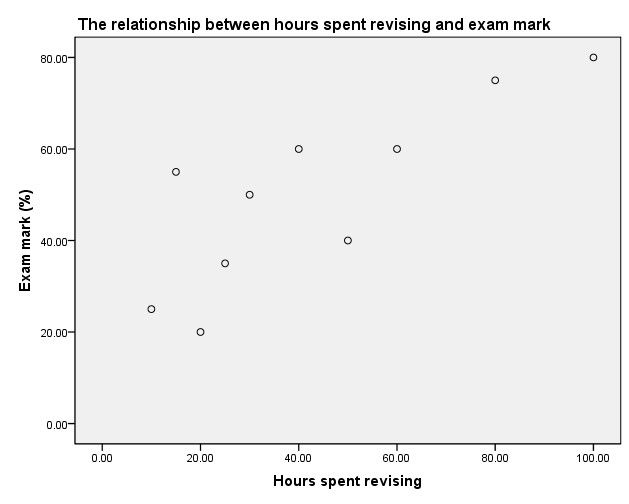
Simple Line Regression
- There was a positive [or negative] correlation
between {predictor} and {criterion}, Beta=__ and
__% of the variation in {criterion} could be
accounted for by variation in{predictor}
(adjusted Rsquared). [Predictor] is a
{non}significant predictor of [criterion], t=__,
p=__.. As [predictor] increases, [criterion] also
tend to increases{decreases}. The relationship
can be described by the linear regression
equation Y=a+b(X), where X is an individual
participants [predictor] and Y is the best
predicition of their [criterion]. The standard
deviation od the estimate was __.
- Adjusted Rsquared (percentage of variance)::-
takes account of the number of particpants in
the study and number of predictor variables
entered into the equation (X)
- Standard Error of Estimate:-
is an average amount by
which a given estimate is
likely to be wrong
- Adjusted Rsquared (percentage of variance)::-
takes account of the number of particpants in
the study and number of predictor variables
entered into the equation (X)
- Models the relationship between 2 variables
- Association:- looking at the relationship between the 2 variables
- Correlation vs Regression-> measures the strength of the linear relationship between 2 varibales
- X=predictor
Horizontal
- Y=criterion
Vertical
- Y=criterion
Vertical
- Regression line (line of best fit) allow us to make predictions. Equation/model- Y= a+b X
- Substitute the value of X(_) into the regression equation Y=a+bX.. We
would therefore have Y=[B constant] + [the next coefficient] (_)
- Substitute the value of X(_) into the regression equation Y=a+bX.. We
would therefore have Y=[B constant] + [the next coefficient] (_)
Anexos de mídia
Quer criar seus próprios Mapas Mentais gratuitos com a GoConqr? Saiba mais.