
Mapa mental
Statistics
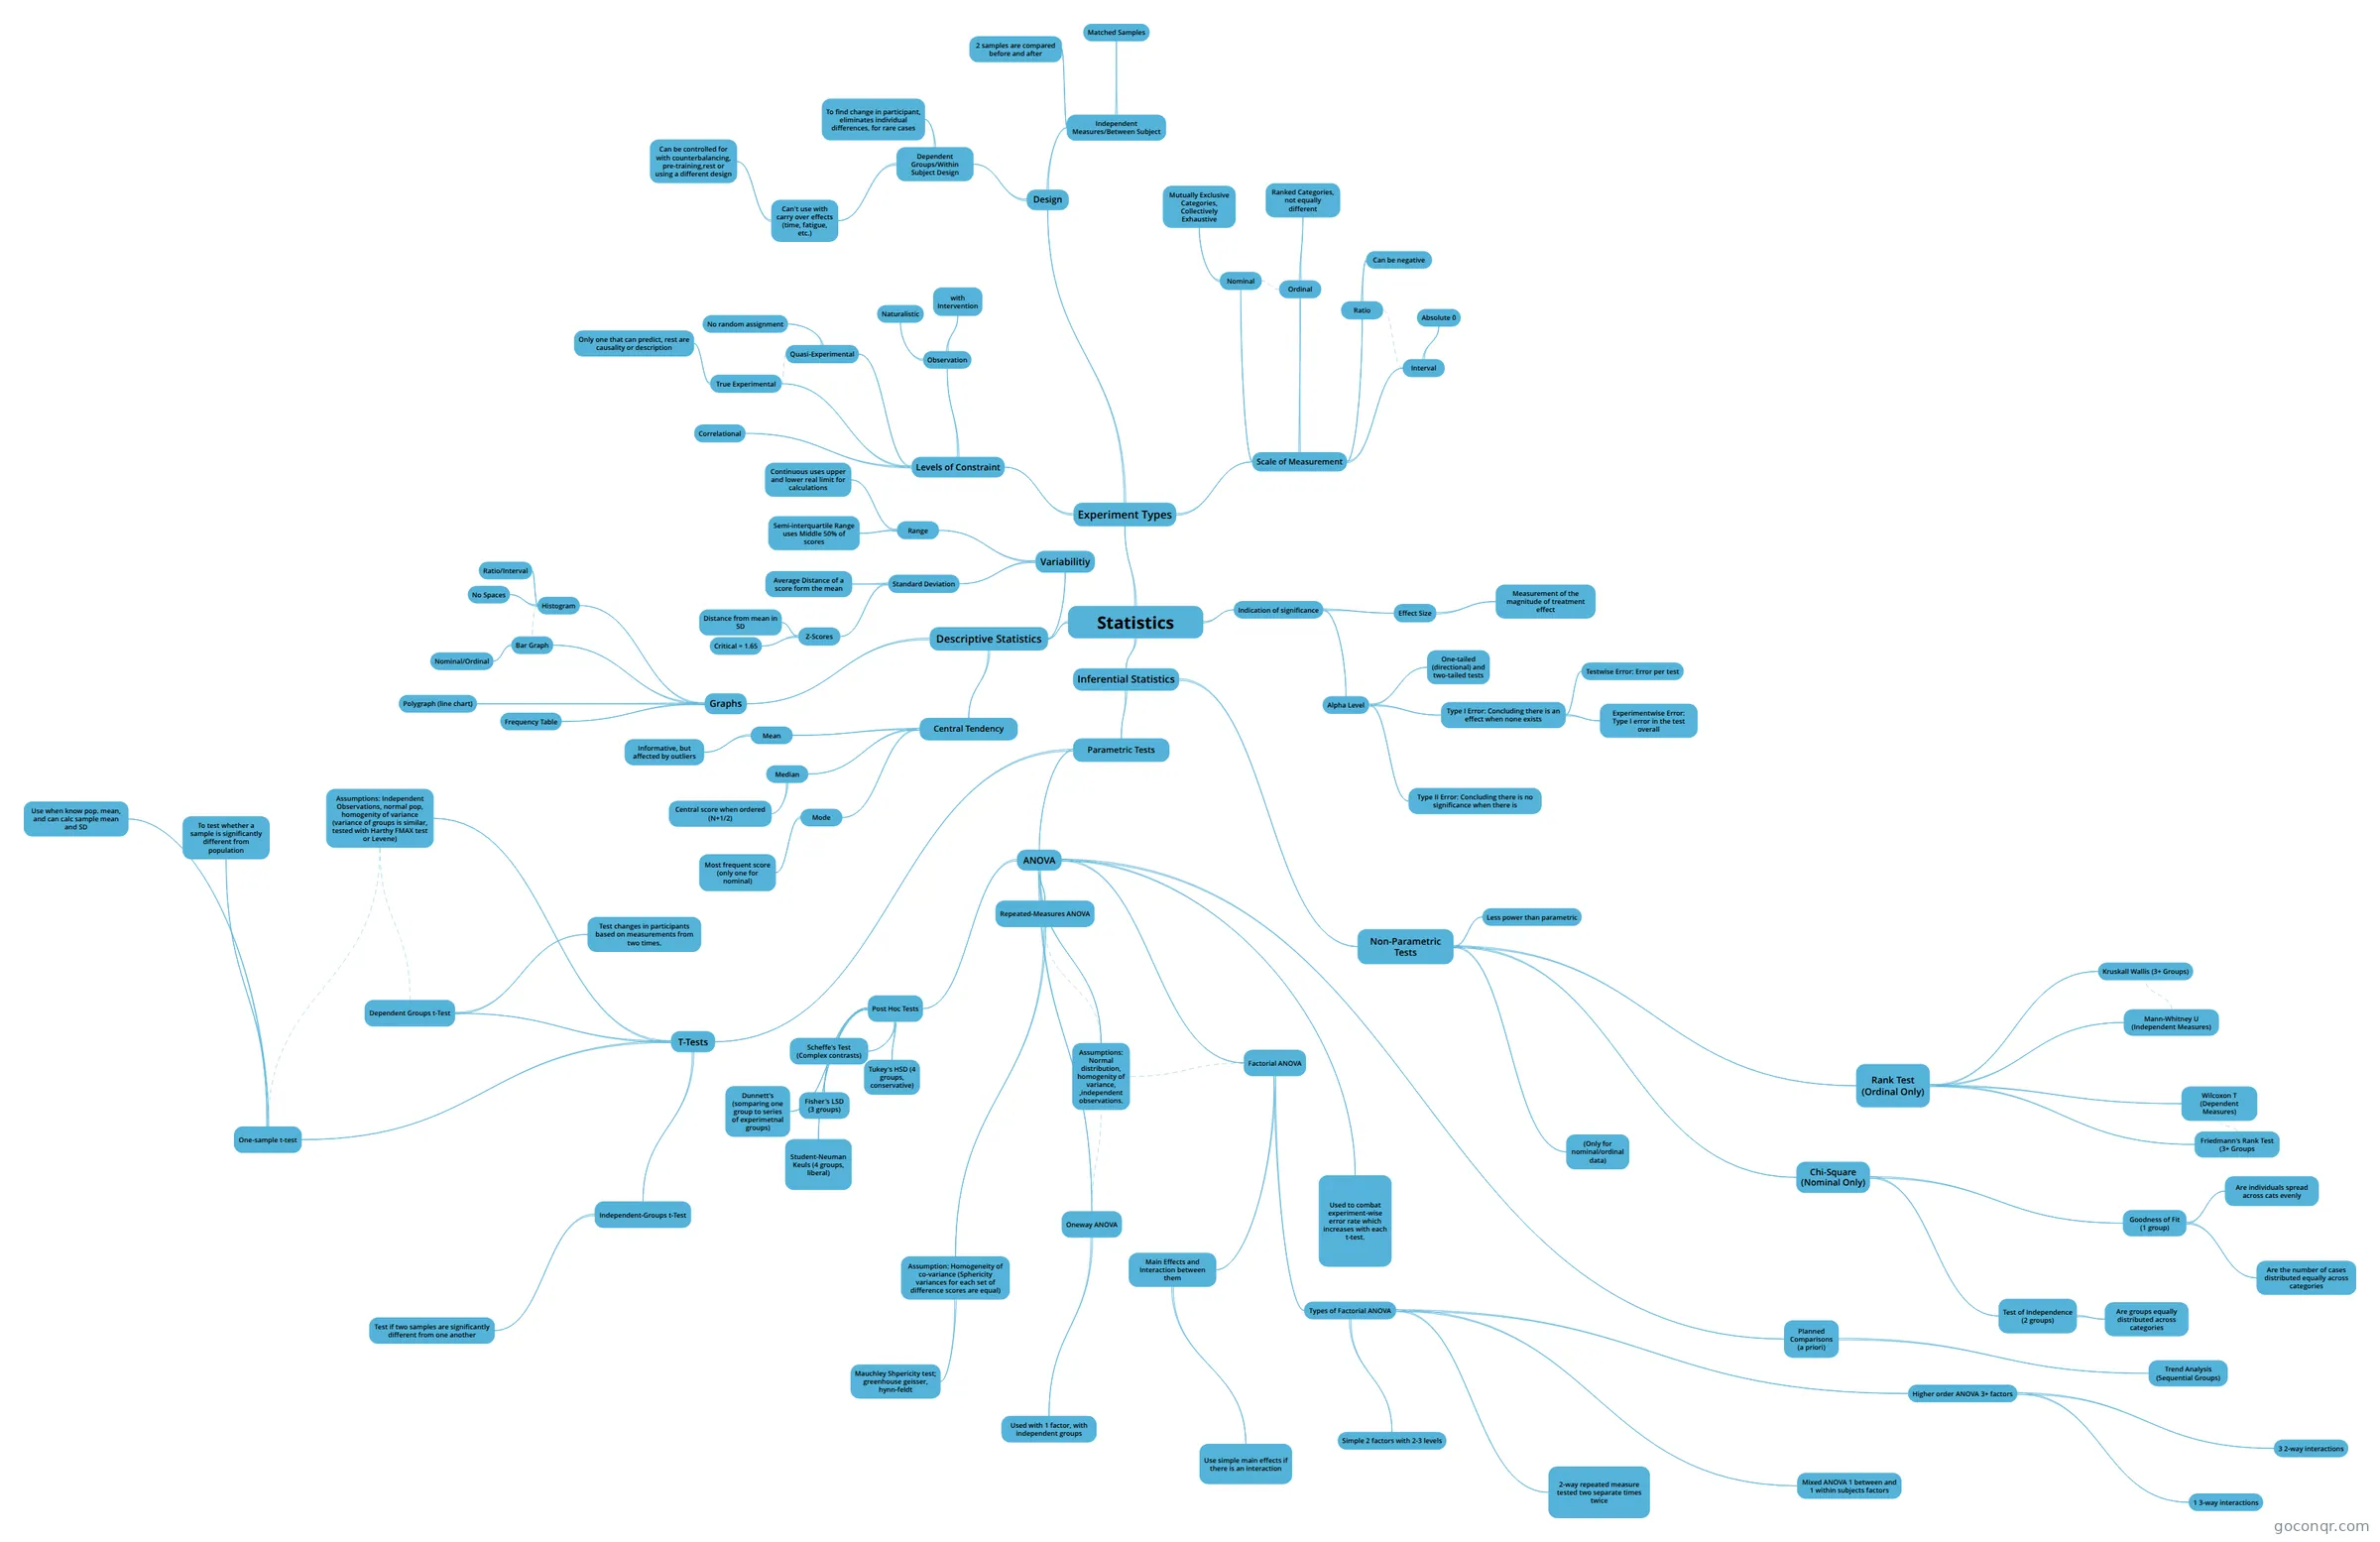
Mind map: Statistics
Conteúdo do mapa
Statistics
Experiment Types
- Levels of Constraint
- Correlational
- True Experimental
- Only one that can predict, rest are causality or description
- Quasi-Experimental
- No random assignment
- Observation
- Naturalistic
- with Intervention
- Design
- Dependent Groups/Within Subject Design
- To find change in participant, eliminates individual differences, for rare cases
- Can't use with carry over effects (time, fatigue, etc.)
- Can be controlled for with counterbalancing, pre-training,rest or using a different design
- Independent Measures/Between Subject
- 2 samples are compared before and after
- Matched Samples
- Dependent Groups/Within Subject Design
- Scale of Measurement
- Interval
- Absolute 0
- Ratio
- Can be negative
- Ordinal
- Ranked Categories, not equally different
- Nominal
- Mutually Exclusive Categories, Collectively Exhaustive
- Interval
- Levels of Constraint
Descriptive Statistics
- Variabilitiy
- Range
- Continuous uses upper and lower real limit for calculations
- Semi-interquartile Range uses Middle 50% of scores
- Standard Deviation
- Z-Scores
- Distance from mean in SD
- Critical = 1.65
- Average Distance of a score form the mean
- Z-Scores
- Range
- Central Tendency
- Mean
- Informative, but affected by outliers
- Median
- Central score when ordered (N+1/2)
- Mode
- Most frequent score (only one for nominal)
- Mean
- Graphs
- Histogram
- Ratio/Interval
- No Spaces
- Bar Graph
- Nominal/Ordinal
- Frequency Table
- Polygraph (line chart)
- Histogram
- Variabilitiy
Inferential Statistics
- Parametric Tests
- T-Tests
- One-sample t-test
- Use when know pop. mean, and can calc sample mean and SD
- To test whether a sample is significantly different from population
- Independent-Groups t-Test
- Test if two samples are significantly different from one another
- Dependent Groups t-Test
- Test changes in participants based on measurements from two times.
- Assumptions: Independent Observations, normal pop, homogenity of variance (variance of groups is similar, tested with Harthy FMAX test or Levene)
- One-sample t-test
- ANOVA
- Oneway ANOVA
- Used with 1 factor, with independent groups
- Repeated-Measures ANOVA
- Assumption: Homogeneity of co-variance (Sphericity variances for each set of difference scores are equal)
- Mauchley Shpericity test; greenhouse geisser, hynn-feldt
- Assumption: Homogeneity of co-variance (Sphericity variances for each set of difference scores are equal)
- Factorial ANOVA
- Main Effects and Interaction between them
- Use simple main effects if there is an interaction
- Types of Factorial ANOVA
- Simple 2 factors with 2-3 levels
- Higher order ANOVA 3+ factors
- 3 2-way interactions
- 1 3-way interactions
- Mixed ANOVA 1 between and 1 within subjects factors
- 2-way repeated measure tested two separate times twice
- Main Effects and Interaction between them
- Used to combat experiment-wise error rate which increases with each t-test.
- Assumptions: Normal distribution, homogenity of variance, ,independent observations.
- Post Hoc Tests
- Fisher's LSD (3 groups)
- Tukey's HSD (4 groups, conservative)
- Student-Neuman Keuls (4 groups, liberal)
- Dunnett's (somparing one group to series of experimetnal groups)
- Scheffe's Test (Complex contrasts)
- Planned Comparisons (a priori)
- Trend Analysis (Sequential Groups)
- Oneway ANOVA
- T-Tests
- Non-Parametric Tests
- Chi-Square (Nominal Only)
- Goodness of Fit (1 group)
- Are individuals spread across cats evenly
- Are the number of cases distributed equally across categories
- Test of Independence (2 groups)
- Are groups equally distributed across categories
- Goodness of Fit (1 group)
- Rank Test (Ordinal Only)
- Mann-Whitney U (Independent Measures)
- Wilcoxon T (Dependent Measures)
- Friedmann's Rank Test (3+ Groups
- Kruskall Wallis (3+ Groups)
- (Only for nominal/ordinal data)
- Less power than parametric
- Chi-Square (Nominal Only)
- Parametric Tests
Indication of significance
- Effect Size
- Measurement of the magnitude of treatment effect
- Alpha Level
- One-tailed (directional) and two-tailed tests
- Type I Error: Concluding there is an effect when none exists
- Testwise Error: Error per test
- Experimentwise Error: Type I error in the test overall
- Type II Error: Concluding there is no significance when there is
- Effect Size
Informações
- Descrição
- Research Design and Analysis
- Criado por
- Minthia Meghan
- Visualizações
- 43
- Tags
- Avaliação