
Mapa mental
ELECTIONS
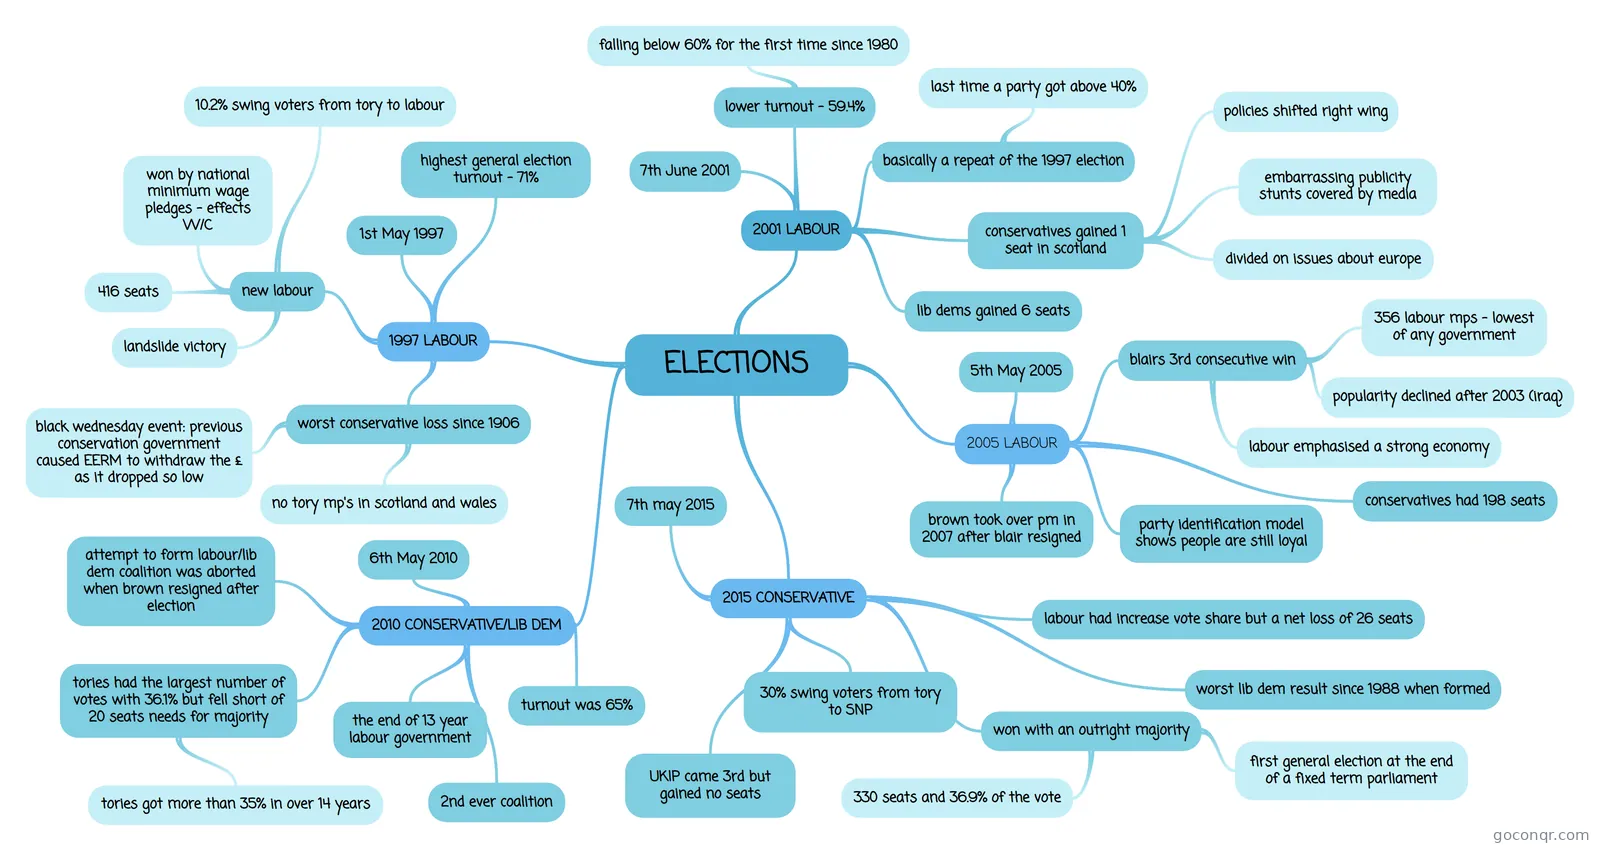
Mind map: UK general elections 1997-2015
Conteúdo do mapa
ELECTIONS
1997 LABOUR
- 1st May 1997
- worst conservative loss since 1906
- no tory mp's in scotland and wales
- black wednesday event: previous conservation government caused EERM to withdraw the £ as it dropped so low
- new labour
- 416 seats
- landslide victory
- won by national minimum wage pledges - effects W/C
- 10.2% swing voters from tory to labour
- highest general election turnout - 71%
2001 LABOUR
- 7th June 2001
- lower turnout - 59.4%
- falling below 60% for the first time since 1980
- basically a repeat of the 1997 election
- last time a party got above 40%
- lib dems gained 6 seats
- conservatives gained 1 seat in scotland
- divided on issues about europe
- policies shifted right wing
- embarrassing publicity stunts covered by media
2005 LABOUR
- 5th May 2005
- blairs 3rd consecutive win
- 356 labour mps - lowest of any government
- popularity declined after 2003 (iraq)
- labour emphasised a strong economy
- conservatives had 198 seats
- party identification model shows people are still loyal
- brown took over pm in 2007 after blair resigned
2010 CONSERVATIVE/LIB DEM
- 6th May 2010
- tories had the largest number of votes with 36.1% but fell short of 20 seats needs for majority
- tories got more than 35% in over 14 years
- attempt to form labour/lib dem coalition was aborted when brown resigned after election
- 2nd ever coalition
- the end of 13 year labour government
- turnout was 65%
2015 CONSERVATIVE
- 7th may 2015
- won with an outright majority
- 330 seats and 36.9% of the vote
- first general election at the end of a fixed term parliament
- labour had increase vote share but a net loss of 26 seats
- UKIP came 3rd but gained no seats
- 30% swing voters from tory to SNP
- worst lib dem result since 1988 when formed
Informações
- Descrição
- elections from 1997-2015
- Criado por
- Livvy Bridges
- Visualizações
- 132
- Tags
- Avaliação