
Mapa mental
Data Representation
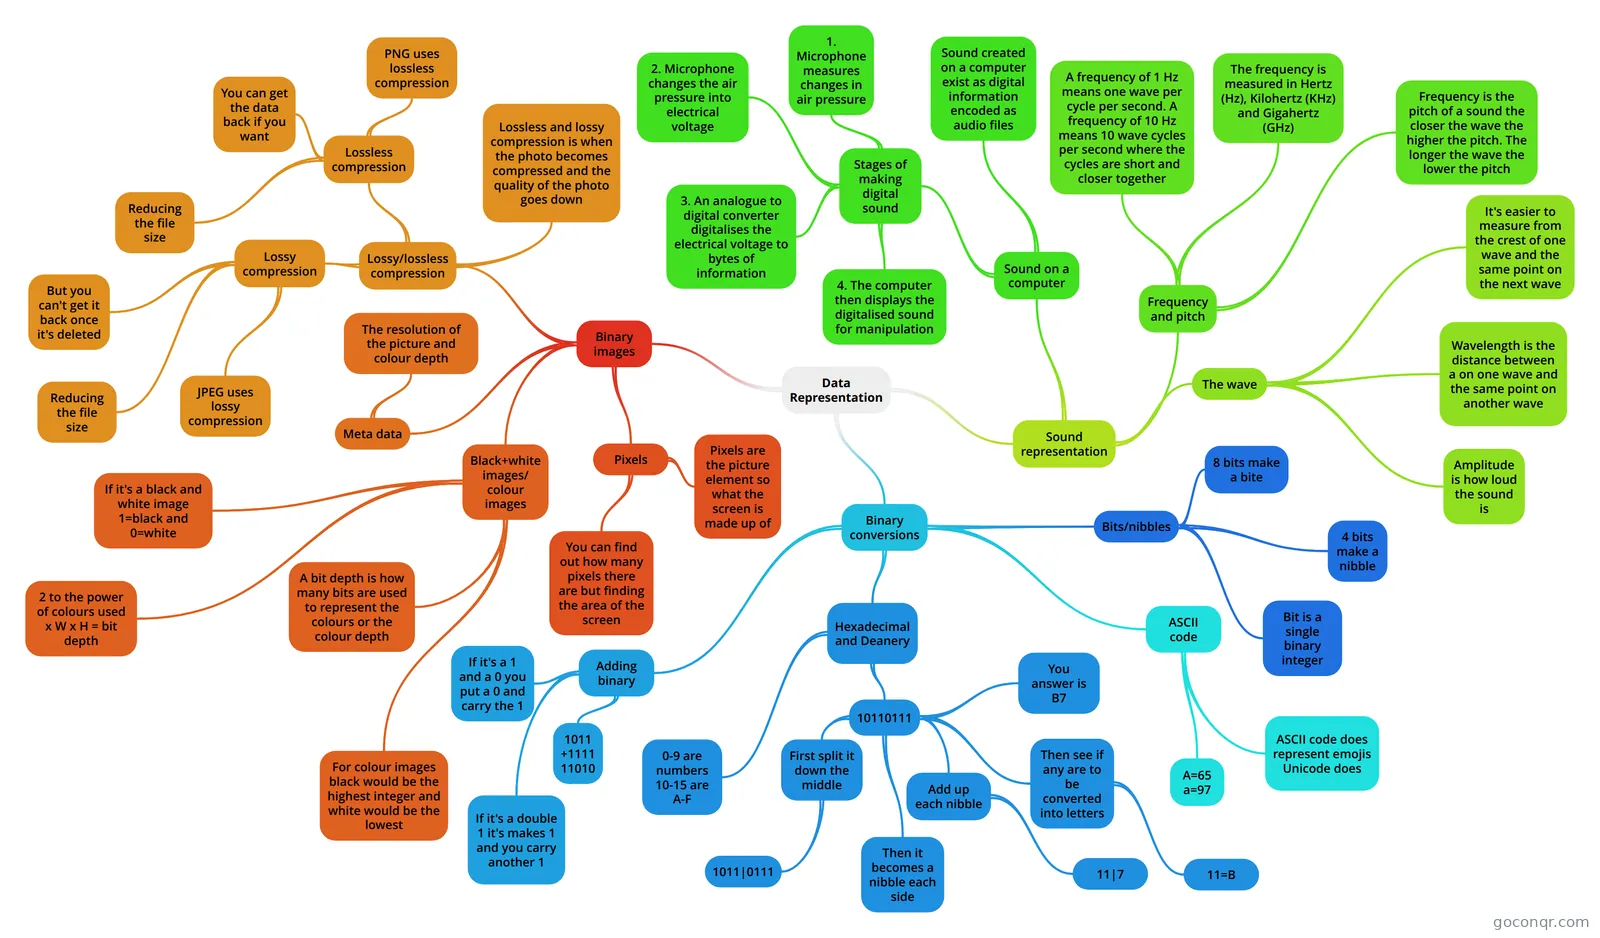
Mind map: Data representation
Conteúdo do mapa
Data Representation
Binary conversions
- Adding binary
- 1011 +1111 11010
- If it's a double 1 it's makes 1 and you carry another 1
- If it's a 1 and a 0 you put a 0 and carry the 1
- Hexadecimal and Deanery
- 0-9 are numbers 10-15 are A-F
- 10110111
- First split it down the middle
- 1011|0111
- Then it becomes a nibble each side
- Add up each nibble
- 11|7
- Then see if any are to be converted into letters
- 11=B
- You answer is B7
- First split it down the middle
- ASCII code
- A=65 a=97
- ASCII code does represent emojis Unicode does
- Bits/nibbles
- Bit is a single binary integer
- 4 bits make a nibble
- 8 bits make a bite
- Adding binary
Binary images
- Pixels
- Pixels are the picture element so what the screen is made up of
- You can find out how many pixels there are but finding the area of the screen
- Black+white images/ colour images
- If it's a black and white image 1=black and 0=white
- For colour images black would be the highest integer and white would be the lowest
- A bit depth is how many bits are used to represent the colours or the colour depth
- 2 to the power of colours used x W x H = bit depth
- Meta data
- The resolution of the picture and colour depth
- Lossy/lossless compression
- Lossy compression
- Reducing the file size
- But you can't get it back once it's deleted
- JPEG uses lossy compression
- Lossless compression
- Reducing the file size
- You can get the data back if you want
- PNG uses lossless compression
- Lossless and lossy compression is when the photo becomes compressed and the quality of the photo goes down
- Lossy compression
- Pixels
Sound representation
- The wave
- Amplitude is how loud the sound is
- Wavelength is the distance between a on one wave and the same point on another wave
- It's easier to measure from the crest of one wave and the same point on the next wave
- Frequency and pitch
- Frequency is the pitch of a sound the closer the wave the higher the pitch. The longer the wave the lower the pitch
- The frequency is measured in Hertz (Hz), Kilohertz (KHz) and Gigahertz (GHz)
- A frequency of 1 Hz means one wave per cycle per second. A frequency of 10 Hz means 10 wave cycles per second where the cycles are short and closer together
- Sound on a computer
- Sound created on a computer exist as digital information encoded as audio files
- Stages of making digital sound
- 4. The computer then displays the digitalised sound for manipulation
- 3. An analogue to digital converter digitalises the electrical voltage to bytes of information
- 2. Microphone changes the air pressure into electrical voltage
- 1. Microphone measures changes in air pressure
- The wave
Informações
- Descrição
- GCSE Computing, Mind Map on Data representation, created by Melissa Norwood on 12/03/2017.
- Criado por
- Melissa Norwood
- Visualizações
- 29
- Avaliação