
Notas
Population - created from Mind Map
Conteúdo das notas (1)
Página 1
Population Distribution
Population Policies
Key Statistics
Key Words
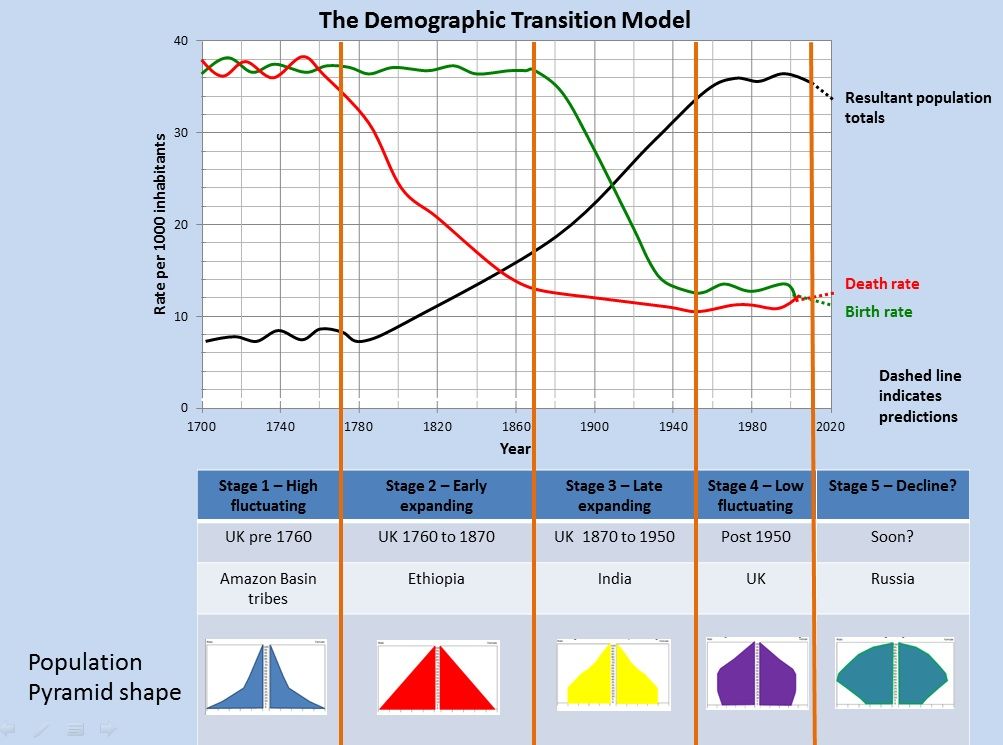
Demographic Transition Model
Population characteristics
TIP: When asked to describe population on a global level look for general patterns and refer to things like continents, areas and hemispheres. Remember to name examples and why its distributed in that way.
Factors affecting distribution
Relief
Water
Climate
Vegetation
Soils
Disease and pests
Political factors
Economies
Communications
Natural resources
Explanation for high population:Low lying, flat areas will encourage settlement. Flat land is likely to have a deep soil layer. For example, The Nile Delta.
Explanation for low population:Rugged high mountains area a particularly difficult place to settle. For example, The Himalayas.
Explanation for high population: A fresh water supply will encourgae settlement. In the UL we are lucky not ot have to think abou this.
Explanation for low population: Areas where water supply is inconsitent, in short supply or polluted will have difficulty maintaing a population. For example, Ethiopia.
Explanation for high population: A temperate climate avoids extreme so encourages settlement. Sydney has temperate climate.
Explanation for low population: Harsh climates will discourage settlement. The harsh climate of the Australian Outback has prevented any major settlement.
Explanation for high population:Temperate areas have easily manageable vegetation. For example, The South East of the UK.
Explanation for low population:Vegetation such as that found in the Amazon rainforest can be a physical barrier to settlement.
Explanation for high population:Deep humus filled soils or those enriched by silt deposits allow a good agricultural yield so can support a larger population. For example, The Nile Delta.
Explanation for low population:Thin, unproductive or damaged soils cannot produce high yields so fail to support a large population. For example, The Soils of the Sahel.
Explanation for high population:A country can have sufficient finance to eradicate diseases and pests. For example, in Southern Italy malarial swamps were drained removing the disease.
Explanation for low population:Many countries particularly around the tropics still have huge problems with diseases and pests. The Bilharzia Snail is one of the biggest killers in Egypt.
Explanation for high population: Areas that receive high levels of investment are more likely to have a large population. Brasilia is an excellent example of this.
Explanation for low population: Rural areas in Mid and West Wales have had very little investment and therefore have a low population density.
Explanation for high population:Some of the biggest growth regions in the UK are due to the healthy state of their economies. Silicon glen in Scotland and Silicon Fen in/near Cambridge in England are both densely populated because of the success of the IT industry, which attracts migrants.
Explanation for low population:A poorly developed economy will be unable to support major populations such as Mozambique.
Explanation for high population: Natural or later mand made communications will have a big influence on size of settlement. Rio De Janeiro has developed around a port. Manaus' population is a consequence of the communication link provided by the amazon.
Explanation for low population:Population growth in northern parts of Scotland has been hindered by poor natural communications and a lack of investment since.
Explanation for high population:The UK was able to sustain a large population because of the dicovery of easily accessible, high-grade coal.
Explanation for low population:Many areas in Africa lack natural resources or more significantly the finance or technology to exploit them. Again you could use Mozambique as an example.
A population policy is a deliberate attempt by the Government to influence the population of a country.
Case study: China's One Child Policy (1979)
Case Study: France's Pro-natalist Policy
Why was it introduced?
Why has is been criticised?
What were the rules?
What were the exceptions?
it was introduced to control and maintain an 'explosive' population to avoid inevitable famine, mass starvation, and to persue economic developement.
Mothers expecting a second child are 'encouraged' to have an abortion. This encouragement is very forceful. Some women have abortions at eight months.
The dependency ratios are very high and will increase as the population becomes increasingly elderly.
Evidence of high rates of female infanticide as parents want male child. The custom in China is that when a couple marry they go to live with the males' parents. This means that they will look after them in old age. If your child is a girl you will not have anyone to look after you in old age.
Orphanages that are under-funded look after thousands of abandoned females.
'Little Emperor Syndrome' - there is a concern that many of the single children are being badly spoilt possibly creating a future society of selfish people.
Before getting married a couple will be tutored and tested on family planning.
Before having a child they have to apply for a certificate from their factory. Only so many certificates are issued annually. If the factory meets certain targets of population control then every worker will get a wage increase.
A couple signing a form promising to have just one child will be given bonuses at work, receive priority for housing, a school and University place for the child and higher pensions on retirement. If the family then have an additional child all benefits are removed. It is also likely to provoke isolation from their peers as it is not seen as being for the good of the country.
If one child died, or if one was severley disabled a couple would be allowed to have more than one.
If both parents were single children they would be allowed to have two children of their own.
What is it?
what were the incentives?
In France following World War One the government banned all forms of contraception to try and increase the male population that had been badly reduced during the war. This law has since been changed but couples still receive several incentives to have a third child.
A payment of up to and over £1000 for having a third child
30% reduction on public transport.
Increased maternity leave to six months with full pay.
The population of the world is growing by 2.7 people per second.
Today approximately one in three people are under fifteen. This has huge implications for future population growth.
95% of this growth is in the less developed world.
Population distribution
Population density
Birth Rates
Death Rates
Natural change
Population Pyramids
Dependancy Ratios
The way in which a population is spread over an area. This usually requires a description.
The number of people per specified area, for example, population per kilometre squared.
The number of births per thousand people per year.
The number of deaths per thousand people per year.
This is the difference between birth rate and death rate. It tells you by how many the population is growing per thousand of the population per year.
They're a way of displaying the age/sex structure of a population. We can analyse it and plan accordingly.
This is the ratios that compares the percentage of the population available for work (15-64) to those economically inactive.
Stage 1
Stage 2
Stage 3
Stage 4
Stage 5
Birth rates and death rates are high so population is low and stable.
For example Amazonial Tribes and UK pre 1760s
Reasons for high death rates include an unstable political society and therefor possible civil unrest. It has a substinace economy which means food supply is unreliable. The water supply is also likely to be unclean. There is very little medical care or social care. Disease and pests have a dramtic effect on population.
High birth rates would be a natural consequence of the high death rates. People have larger families to compensate for the high infant mortality and so the children can work and support the families, especially when their parents get old. Large Families become part of culture and religion and men are seen as powerful if they have lots of children. Womans role in society is very much as a mother producing children.
Death Rates fall but birth rates remain high. Natural increase is greater so population starts to grow rapidly.
An example is Sri Lanka or Peru, or UK 1760-1880
The falling death rate would of been as a consequence of a medical or social breakthrough. For example new hospitals, vaccinations or legislations to prohibit children working in factories. Alternatively improvements could of been made to water supplies or food and shelter. It will usually be a combination of events.
Birth rates remain high as culture and religion still dictates. There is likely to be very little access to family planning and contraception and women still have a very submissive role in society.
Birth rates now fall and death rates continue to fall. Natural Increase is still high and population growth is rapid.
An example is China and UK 1880- 1940.
Birth Rates will start to fall due to family planning. People will also start to appreciate the expense of having a large family and will opt for fewer children. Woman are getting a better deal from society and have access to the job market and could purse a career instead of being a full time mother.
Death rates continue to fall as the country continues to improve medical and social care, sanitation and living conditions.
Birth Rates and Death Rates level out. Natural increase is low so population stablalises.
Auatralia is a good example, and Uk from 1940s to present.
Society is advanced; woman can pursue careers and live independant lives. Families opt to be smaller because of costs and other factors.
Death Rates remain low. There is little scope for further decline.
Birth Rates fall below death rates so natural increase is now negative. Population will start to decrease.
Japan is at this stage.
Birth rates fall further because people are waiting longer to have families. Parents are aware of the cost to having children so they only have one or two so they can still have a good house, holidays and standard of living. Woman have full access to the job market and family planning is universally accepted and available.
Population characteristics is a way of seeing different factors of a population, for example the age/sex balance.
Population Pyramids
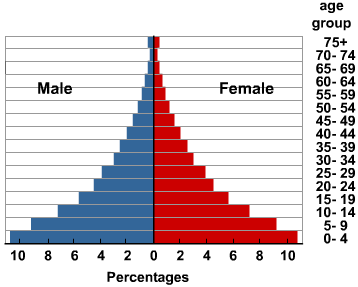
Pyramid One
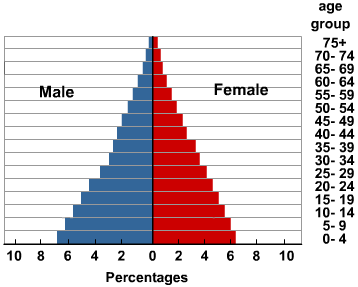
Pyramid Two
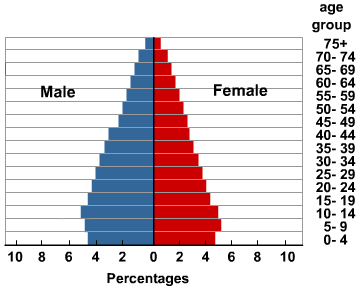
Pyramid Three
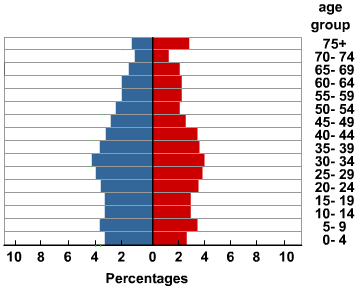
Pyramid Four
Population Pyramids can be infulenced by Migrations, Famines and War.
Here the base is very wide indicating a very high birth rate. The width drops off very quickly. This means people must be dying. Very few reach old age. Few countries are still in this stage today but some rainforest populations would display this pattern.
Implications: Clear need for investment into water supplies, health care, food supplies and housing to reduce death rates.
Still a large base so high birth rate but also a wider and taller pyramid as more people are living to older ages. This is stage two of the demographic transition model and includes many countries in Africa such as Kenya.
Implications:Probable need to invest in education about family planning to reduce birth rate. Possibly indicates that women are undervalued in society so this could be tackled.
Note the more 'domed' shape. It means many people are living to older ages as quality of life improves. There are also proportionately fewer births. This is stage three of the demographic transition model. Chile would be a good example.
Implications:As the population becomes increasingly older there may be a need to invest in facilities and services for them. Still a need for continued investment in family planning.
Very small base due to the very low birth rates and death rates displayed in the wide top. This would be representative of Australia that has recently come through stage three of the demographic transition model.
Implications:Should the situation continue there are serious implications about providing for the elderly population (increasing cost of health care, state pensions) especially as the working population becomes proportionally smaller. This is a major concern in much of the developed world.
Informações
- Descrição
- Grade 10 Geography Notas sobre Population - created from Mind Map, criado por Kiara Jones em 17-09-2018.
- Criado por
- Kiara Jones
- Visualizações
- 4
- Histórico
-
- Criado por chloejanesheppar · 17 set 2018
- Copiado por Kiara Jones · 17 set 2018
- Copiado para Nota por Kiara Jones · 17 set 2018
- Avaliação