
Quiz
0654 B13 Impacts of Humans on Ecosystems Quiz
Perguntas do quiz (30)
1The diagram represents the carbon cycle.
Which process is represented by arrow X?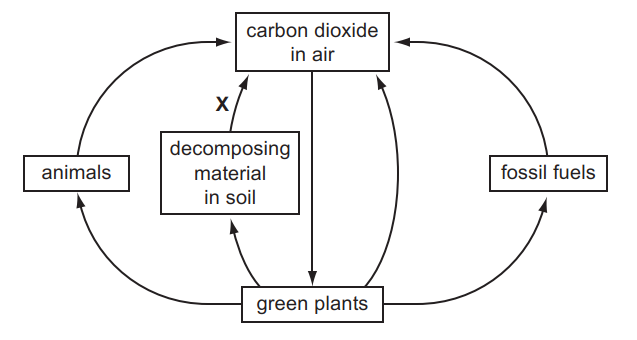
- AA combustion
- BB feeding
- CC photosynthesis
- DD respiration
2The graph shows the increase in the human population of the world since 1630.
What was the longest time taken for the population to double?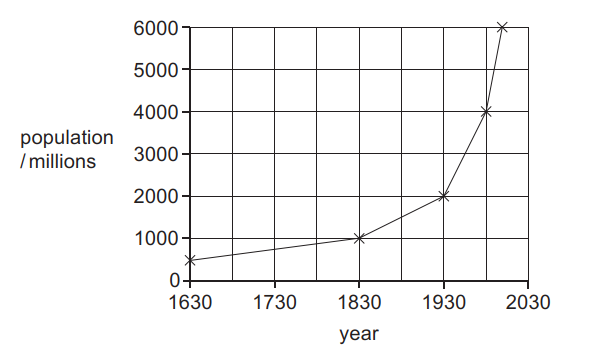
- AA 100 years
- BB 200 years
- CC 300 years
- DD 400 years
3The graphs show the number of carnivores in a habitat over a period of time.
At time X the herbivores in their food chain are removed from the habitat.
Which graph shows the effect of this on the number of carnivores?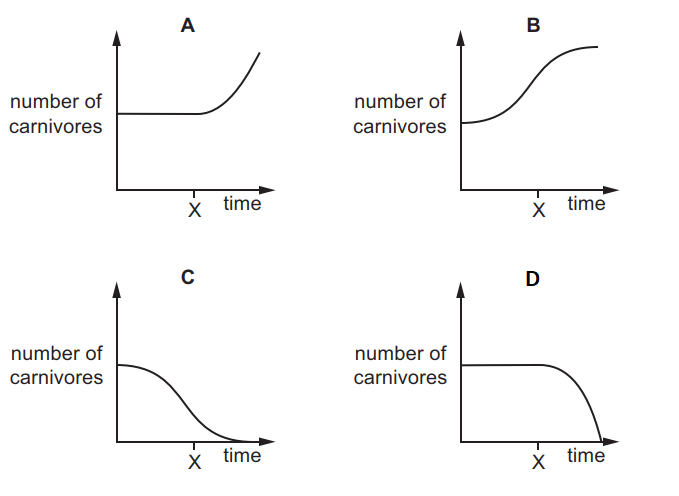
- AA
- BB
- CC
- DD
4The diagram shows the positions of four farms and the concentrations of nitrate at different points in a river.
Which farm is likely to have been using too much fertiliser on its land?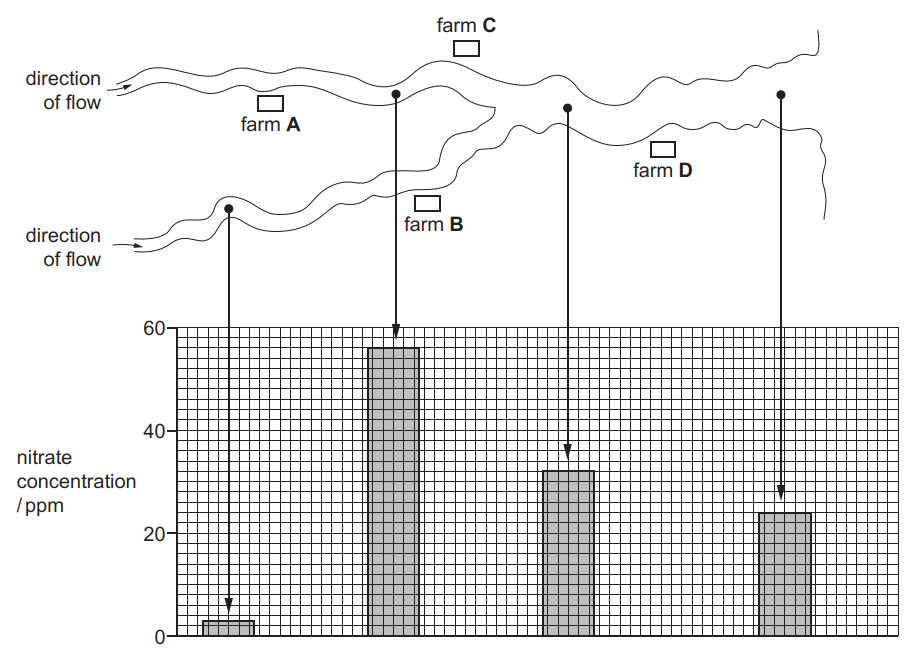
- AA
- BB
- CC
- DD
5The table shows some information about two closely related species of sea bird.
Sewage pollution at the mouth of a river destroys its fish stocks.
What is likely to happen to local populations of these birds?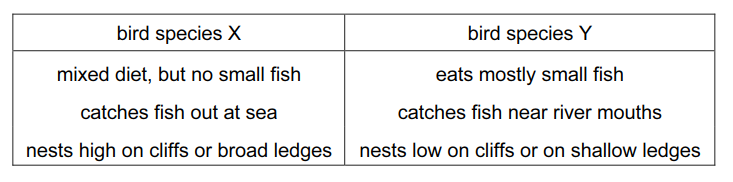
- AA There will be no change to either species.
- BB Species X numbers will decrease, species Y will remain constant.
- CC Species Y numbers will decrease, species X will remain constant.
- DD Both species numbers will increase.
6Three human activities are listed.
1 burning fossil fuels
2 deforestation
3 overusing fertilisers
Which activities can cause the change shown in the graph?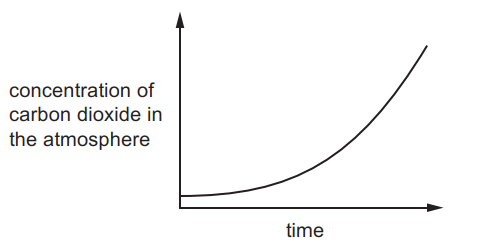
- AA 1, 2 and 3
- BB 1 and 2 only
- CC 1 only
- DD 2 and 3 only
7 What is reduced after deforestation?
- AA force of rain hitting the ground
- BB rainwater run-off
- CC soil erosion
- DD soil fertility
8The diagram shows four positions on a river where water samples were taken.
Which graph shows oxygen concentrations in the river?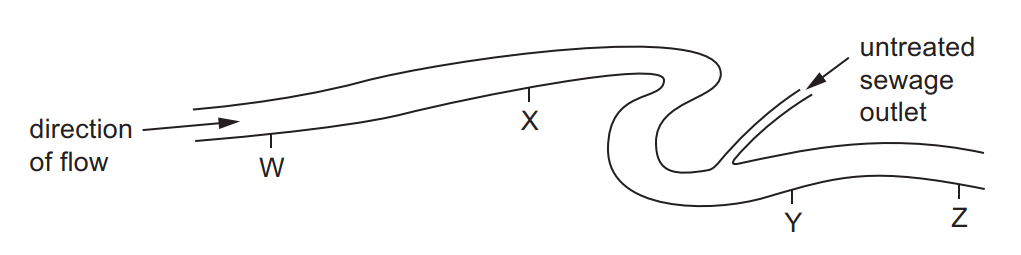
- AA
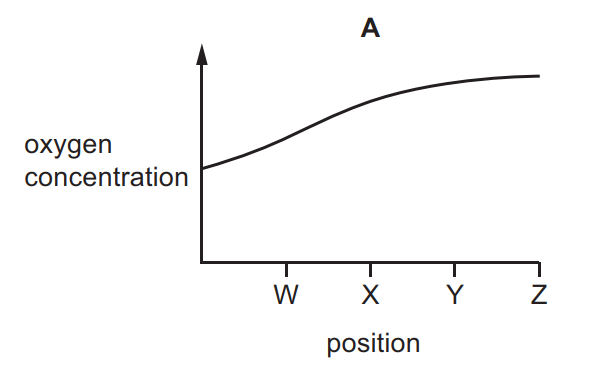
- BB
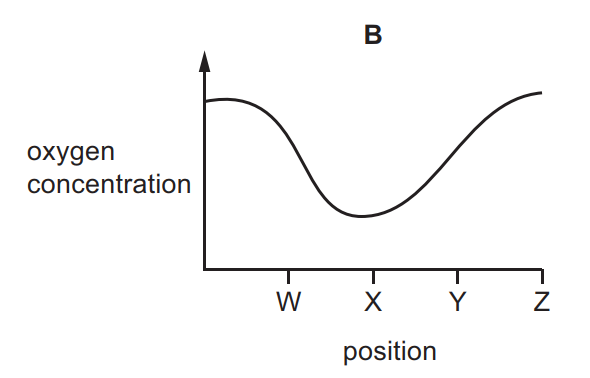
- CC
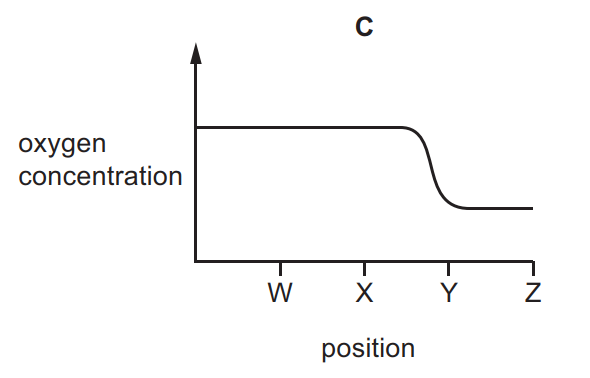
- DD
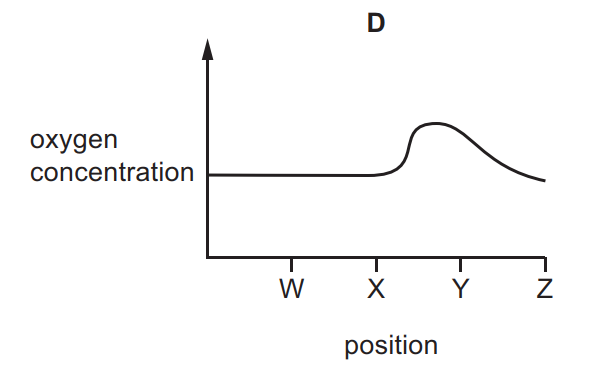
- AA
9A large amount of herbicide is applied to a field. Heavy rainfall carries much of it into a nearby lake.
What will be the effect of this on the lake?- AA Herbicide decreases the growth of water plants.
- BB Herbicide decreases the number of bacteria.
- CC Herbicide increases the rate of evaporation from the lake.
- DD Herbicide kills the fish.
10The table shows the amount of carbon dioxide in the atmosphere in three different years.
What is the most likely cause of this change?
- AA destruction of rainforests
- BB increased use of fertilisers containing nitrogen
- CC pollution of air by sulfur dioxide
- DD rise in the sea level
11Which two gases both contribute to global warming?
- AA carbon dioxide and methane
- BB methane and oxygen
- CC oxygen and sulfur dioxide
- DD sulfur dioxide and carbon dioxide
12Over-use of fertilisers on farmland causes the chemicals in the fertilisers to be washed into ponds and lakes.
This causes eutrophication resulting in the following events.
1 algae grow
2 fish die
3 bacteria grow
4 oxygen decreases
What is the correct sequence of these events?- AA 1 → 3 → 4 → 2
- BB 1 → 4 → 3 → 2
- CC 3 → 4 → 2 → 1
- DD 4 → 1 → 2 → 3
13The concentration of a pesticide in the tissues of the organisms in the following food chain was measured.
Which bar on the chart represents the large fish?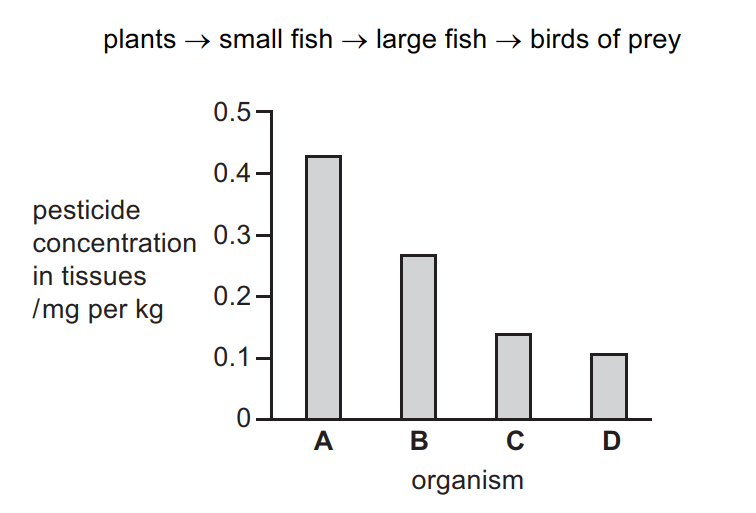
- AA
- BB
- CC
- DD
14The diagram shows how sewage is treated.
Why is air bubbled through the aeration tank?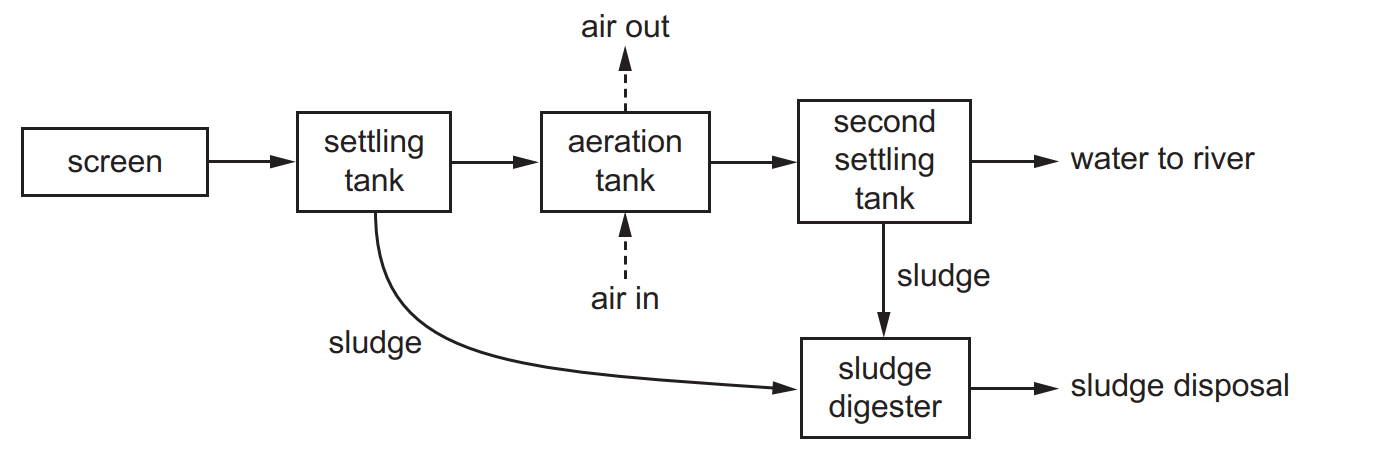
- AA to encourage microorganisms to reproduce quickly
- BB to float the sludge
- CC to settle the sludge
- DD to stop microorganisms from reproducing too quickly
15 Three human activities are listed.
1 burning fossil fuels
2 deforestation
3 overusing fertilisers
Which activities can cause the change shown in the graph?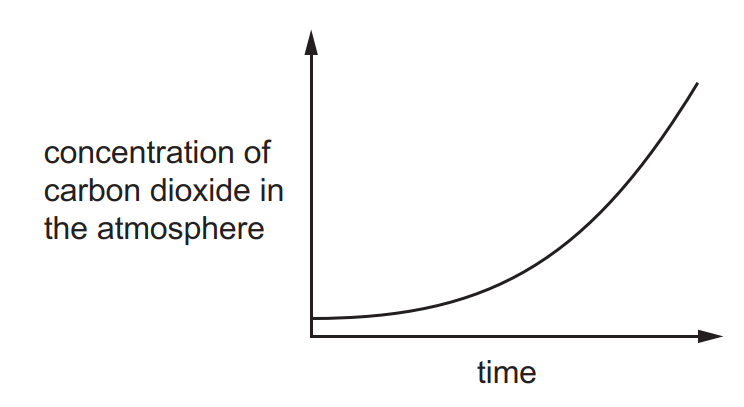
- AA 1, 2 and 3
- BB 1 and 2 only
- CC 1 only
- DD 2 and 3 only
16What is a reason for conserving plant species?
- AA to absorb oxygen from the air
- BB to decrease rainfall
- CC to obtain drugs for medicinal use
- DD to release carbon dioxide into the air
17What is reduced after deforestation?
- AA force of rain hitting the ground
- BB rainwater run-off
- CC soil erosion
- DD soil fertility
18The diagram shows four positions on a river where water samples were taken.
Which graph shows oxygen concentrations in the river?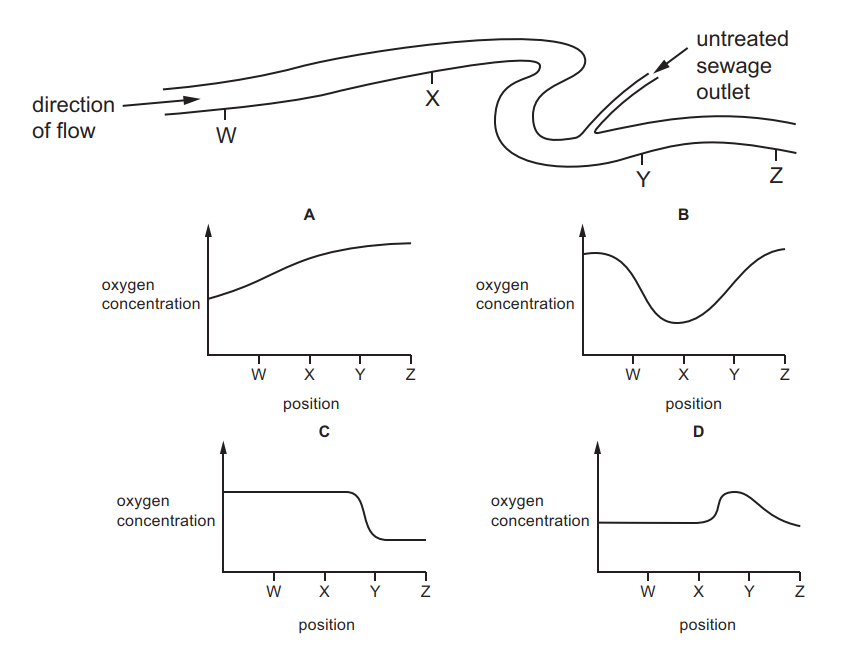
- AA
- BB
- CC
- DD
19Which process may result in eutrophication in a lake?
- AA bleach entering from a factory
- BB fertilisers entering from farmland
- CC hot water entering from a power station
- DD pesticides entering from farmland
20Which two gases are the biggest contributors to the greenhouse effect?
- AA carbon dioxide and methane
- BB carbon monoxide and carbon dioxide
- CC methane and sulfur dioxide
- DD sulfur dioxide and carbon monoxide
21Untreated sewage is released into a river at point X.
Which graph correctly shows changes in oxygen concentration of the water as the river flows away from X?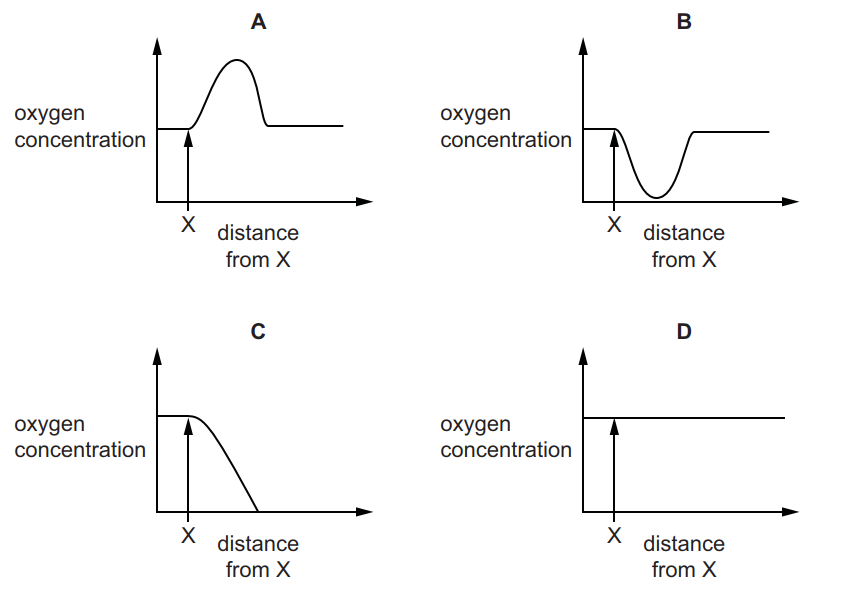
- AA
- BB
- CC
- DD
22What changes in combustion and deforestation increase carbon dioxide in the atmosphere?
- AA
- BB
- CC
- DD
23What is the principal source of energy input into a biological system?
- AA consumer
- BB decomposer
- CC producer
- DD Sun
24Some of the stages of eutrophication are listed.
1 death of organisms requiring dissolved oxygen in water
2 increased availability of nitrate and other ions
3 increased decomposition after death of producers
4 reduction in dissolved oxygen
What is the correct order of these stages in eutrophication?- AA 2 → 1 → 4 → 3
- BB 2 → 3 → 4 → 1
- CC 3 → 2 → 4 → 1
- DD 3 → 4 → 1 → 2
25The list shows changes that occur in a lake which is polluted by nitrogen-containing fertiliser.
1 decomposers feed on plants
2 growth of algae increases on the lake’s surface
3 oxygen levels decrease in the lake
4 underwater plants die
In which order do these changes occur?- AA 2 → 4 → 1 → 3
- BB 2 → 3 → 4 → 1
- CC 3 → 4 → 2 → 1
- DD 3 → 4 → 1 → 2
26The bloodworm is an organism that is found in heavily polluted water.
The diagram shows where raw sewage flows into a river.
Where would there be fewest bloodworms?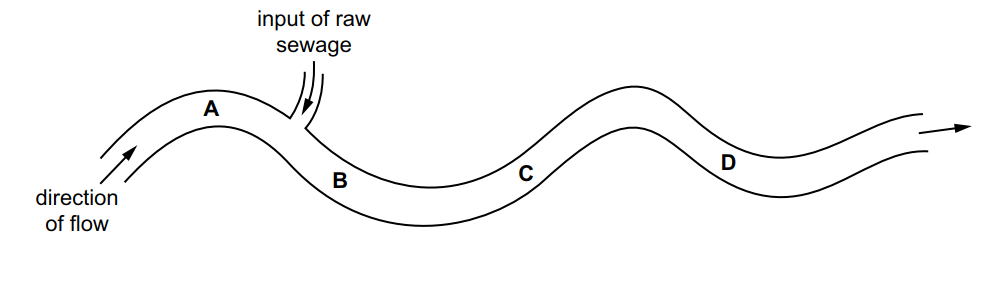
- AA
- BB
- CC
- DD
27What are the possible effects of deforestation?
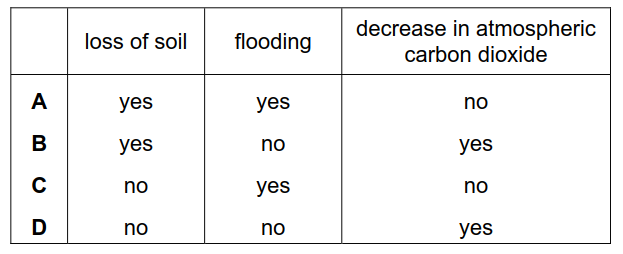
- AA
- BB
- CC
- DD
28Large areas of tropical forests have been cleared to grow monocultures of palm oil plants.
Which effect will this have on the ecosystem?- AA The use of fossil fuels in the area will decrease.
- BB The use of pesticides in the area will decrease.
- CC The variety of species in the area will decrease.
- DD The variety of species in the area will increase.
29What is not a reason for using chemical fertilisers in food production?
- AA improving growth rate
- BB improving mineral content of the soil
- CC increasing yields
- DD reducing competition with weeds
30The diagram shows how sewage is treated.
Why is air bubbled through the aeration tank?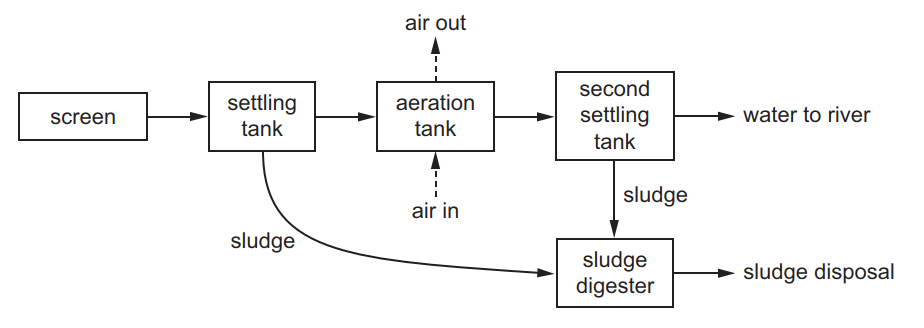
- AA to encourage microorganisms to reproduce quickly
- BB to float the sludge
- CC to settle the sludge
- DD to stop microorganisms from reproducing too quickly
Informações
- Descrição
- Quiz for 0654 Coordinated Sciences on the impact of humans on natural ecosystems.
- Autor
- Jeffrey Piggott
- Idioma
- English
- Visualizações
- 1.037
- Etiquetas
- Avaliação
- Ainda sem avaliações Avalie este quiz