16464466
Description
Quiz by Sinead Sherman, updated more than 1 year ago
|
|
Created by Sinead Sherman
almost 7 years ago
|
|
Question 1
Question
This Figure shows a scatter plot of the relationship between scores on a reading test and scores on a writing test. Based on what you can see from the plot there is:
Image:
Fig1 (binary/octet-stream)
Answer
-
A negative relationship between writing and reading scores.
-
A positive relationship between writing and reading scores.
-
No relationship between writing and reading scores.
-
A weak relationship between writing and reading scores.
Question 2
Question
A researcher explores the relationship between a measure of vanity and the number of selfies posted on-line in a month. The data showed that r = .50. We can therefore determine that Vanity accounted for what percentage of variance in number of selfies posted on-line in a month?
Answer
-
25%
-
50%
-
0.5%
-
5%
Question 3
Question
The process to rule out the influence of one or more additional variables on the relationship between the X and the Y variable is:
Answer
-
regression
-
Yate's correction
-
partial correlation
-
bi-variate correlation
Question 4
Question
When interpreting a correlation analysis, it is important to look at which of the following features?
Answer
-
The strength of relationship
-
The direction of relationship
-
The statistical significance of relationship
-
All of the above
Question 5
Question
Which of the following does a scatterplot show?
Answer
-
The mean value associated with two variables.
-
The proportion of data falling into one of two categories.
-
The frequency with which values appear in the data.
-
Scores on one variable plotted against scores on a second variable.
Question 6
Question
What does the calculation of Covariance tell us?
Answer
-
Whether the scores we have on variables X and Y are normally distributed.
-
The extent to which variability on one variable is associated with a predictable change in another variable before standardisation.
-
The extent to which variability on one variable is associated with a predictable change in another variable after standardisation.
-
The percentage of explained variance between the two variables of interest.
Question 7
Question
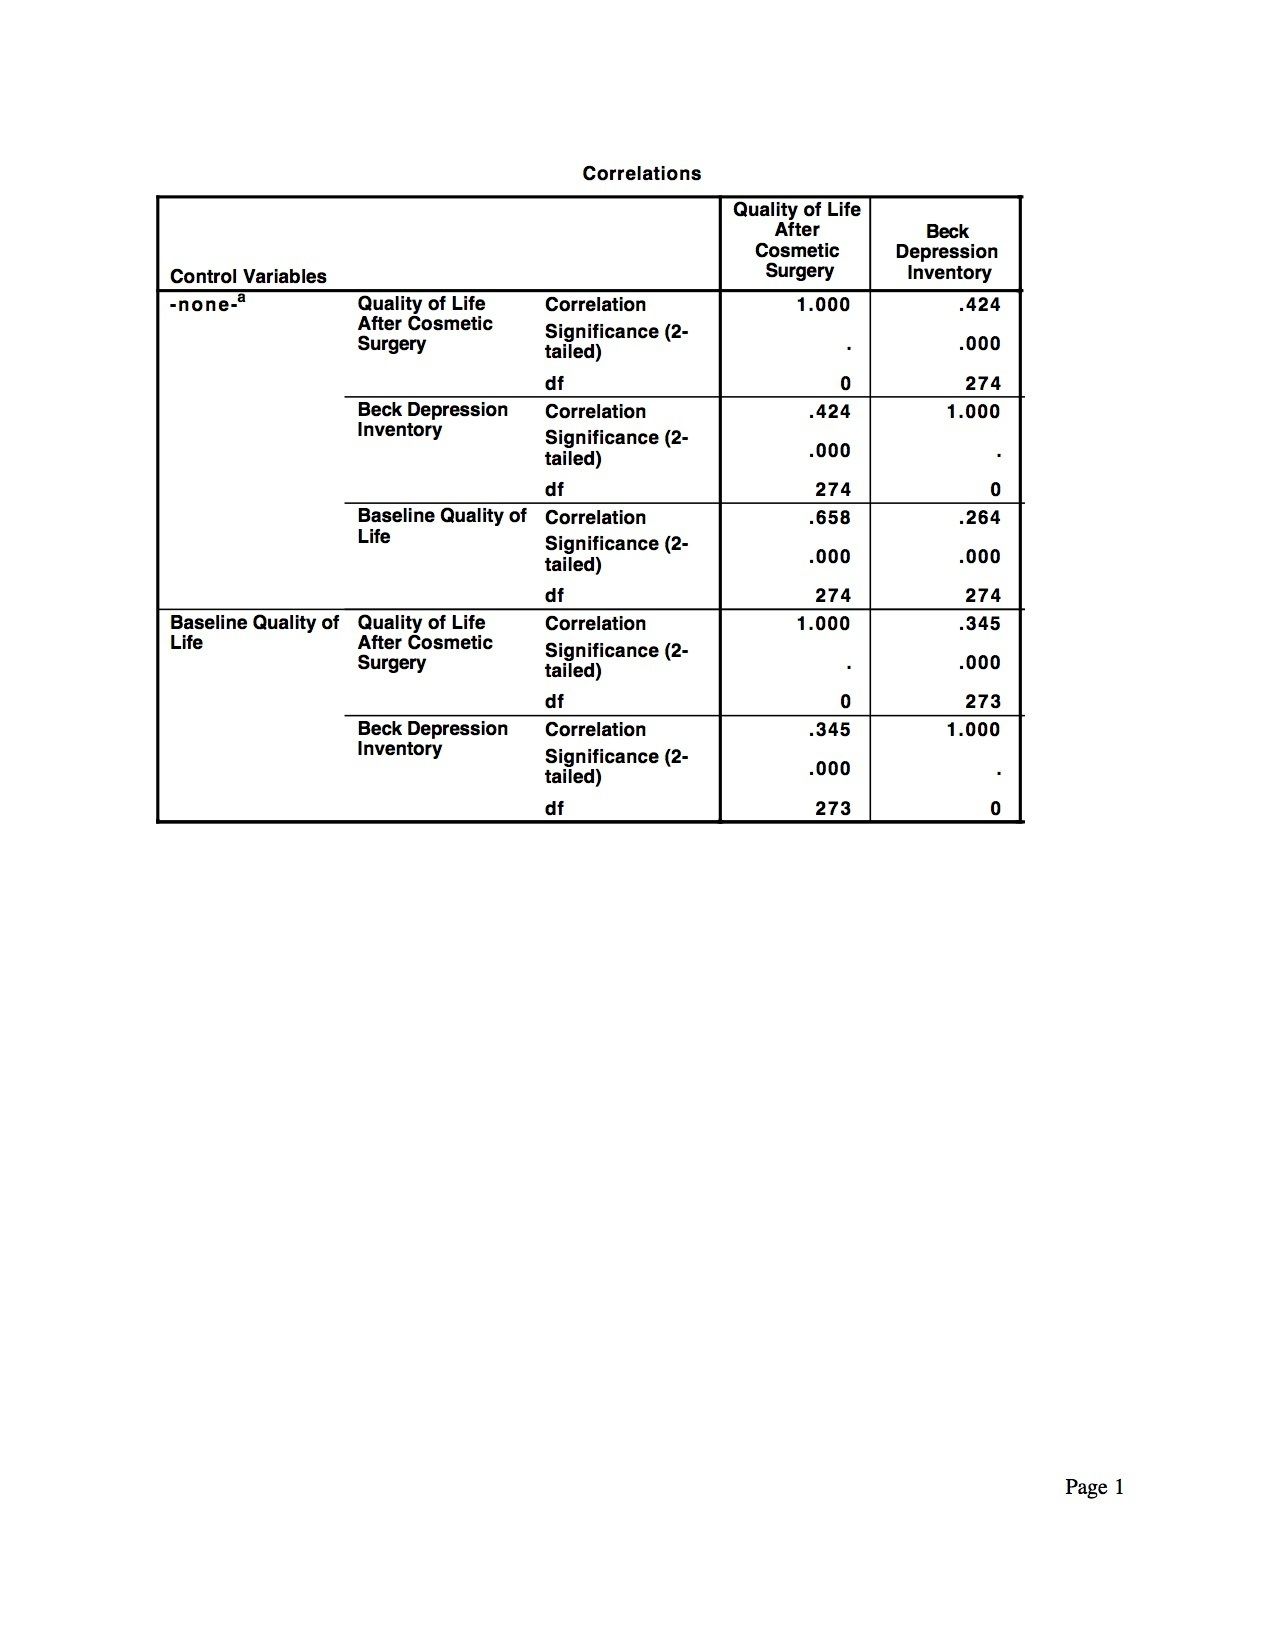
The table below shows us the zero order correlations and the partial correlations between a measure of quality of life after undergoing cosmetic surgery and participants self-reported level of depression , whilst controlling for a measure of quality of life BEFORE undergoing cosmetic surgery. Which of the following is correct.
Answer
-
The proportion of variance explained is reduced once we control for the variability of our measure of quality of life BEFORE undergoing cosmetic surgery.
-
The proportion of variance explained increases once we control for the variability of our measure of quality of life BEFORE undergoing cosmetic surgery.
-
Controlling for the variability of our measure of quality of life BEFORE undergoing cosmetic surgery has no effect on the proportion of variance explained.
-
None of the other options are correct
Question 8
Question
Which of the following is the best description of the difference between a positive and a negative correlation?
Answer
-
A positive correlation shows that changes on X and Y variables are going in the same direction, whilst a negative correlation is showing us that changes on our X and Y variables are going in different directions.
-
A positive correlation shows that changes on X and Y variables are going in the same direction, whilst a negative correlation is showing us that there is no variability on our X and Y variables.
-
We get negative correlations when we control for the influence of a third variable, and the third variable shares a lot of the variance.
-
A negative correlation is a weak one, whilst a positive correlation is a strong one.
Question 9
Question
Which of the following statements is NOT true:
Answer
-
The coefficient of determination is calculated by taking our equation for covariance and dividing by the Mean Score of the two variables of interest
-
The coefficient of determination gives us a value relating to covariance that is in standardised units.
-
The coefficient of determination is calculated by taking our equation for covariance and dividing by the Standard Deviation of the two variables of interest
-
The correlation coefficient gives us a measure of the degree to which the two variables of interest vary together, in unstandardized units of measurement.
Want to create your own Quizzes for free with GoConqr? Learn more.