5086904
Description
Quiz by Jessica Viviana Toledo, updated more than 1 year ago
|
|
Created by Jessica Viviana Toledo
over 9 years ago
|
|
Question 1
Question
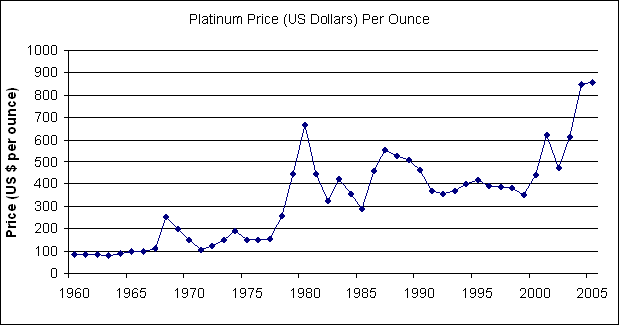
This test is about verbs and related phrases to describe a line graph.
Are you ready?.... Click on TRUE
Answer
- True
- False
Question 2
Question
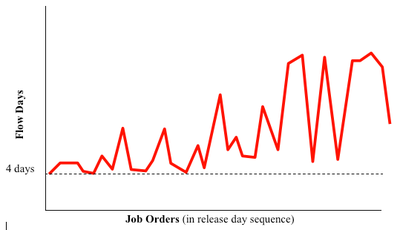
Classify the verbs according to the movement in the graph that they describe.
Answer
-
soar
-
fall
-
remain steady
-
fall
-
soar
-
remain steady
-
fall
-
soar
-
remain steady
-
reach a plateau
-
rise
-
plunge
-
rise
-
plunge
-
reach a plateau
-
rise
-
plunge
-
reach a plateau
-
maintain constant
-
rocket
-
drop
-
rocket
-
drop
-
maintain constant
-
rocket
-
maintain constant
-
drop
-
plummet
-
grow
-
stabilize
-
grow
-
plummet
-
stabilize
-
plummet
-
grow
-
stabilize
Question 3
Question
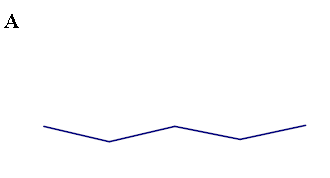
Drag the phrases to describe the graph.
Answer
-
There was a peak.
-
The price remained steady.
-
The price rocketed.
-
The price fluctuated.
-
The price dropped.
-
The price fluctuated wildly.
Question 4
Question
The following verbs describe graphs. What is their form in past tense?
a) rise - [blank_start]rose[blank_end]
b) grow - [blank_start]grew[blank_end]
c) fall - [blank_start]fell[blank_end]
d) sink - [blank_start]sank[blank_end]
Answer
-
rose
-
grew
-
fell
-
sank
Question 5
Question
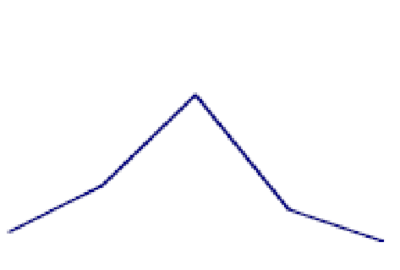
Look at the graph. Is this sentence describing it?
The trend in customer number was upward.
Answer
- True
- False
Question 6
Question
Look at the graph. Is this sentence describing it?
The numbers fell drastically.
Answer
- True
- False
Question 7
Question
Look at the graph. Is this sentence describing it?
There was a slight dip in sales numbers.
Answer
- True
- False
Question 8
Question
Look at the graph, decide which statements are correct in each case.
There may be more than one answer.
Answer
-
Customer numbers hit a peak.
-
There was a peak in customer numbers.
-
There was a slight dip in customer numbers
-
The trend in customer numbers was flat.
Question 9
Question
Look at the graph, decide which statements are correct. There may be more than one option.
Answer
-
There was a downward trend in customer numbers.
-
Customer numbers were erratic.
-
There was a gradual rise in customer numbers.
-
There was a steady fall in customer numbers.
Question 10
Question
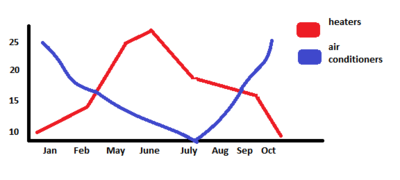
Look at the graph and choose a suitable verb to complete the graph description.
This is a line graph of sales - the blue line represents air conditioner sales, the red line shows heaters.
As you'll note, air conditioner sales [blank_start]dropped[blank_end] steadily from January to July, [blank_start]bottoming out[blank_end] then.
On the other hand, heater sales experienced a sharp [blank_start]increase[blank_end] from March to June, then dropped markedly from June to July, after that, they declined through to September, with a pronounced drop in October.
Answer
-
dropped
-
rose
-
fluctuated
-
soared
-
bottoming out
-
levelling off
-
hitting a peak
-
going up
-
increase
-
went up
-
flat
-
grow
Question 11
Question
Look at the graph, what is your conclusion? Fill in the gap with ONE word.
All in all, there were wild [blank_start]fluctuations[blank_end] along the period.
Answer
-
fluctuations
Question 12
Question
Complete the following sentences with ONE preposition.
a) The graph compares the number of customers [blank_start]from[blank_end] 2010 to 2016.
b) They experienced an upward trend, starting the period [blank_start]at[blank_end] approximately 500 units.
c) The price of the raw materials increased [blank_start]by[blank_end] 30%.
d) The last decade has seen a steep increase [blank_start]in[blank_end] the number of social networks users.
e) The number of sales dropped [blank_start]to[blank_end] 100 per month.
Answer
-
from
-
at
-
by
-
in
-
to
Question 13
Question
Read the following text.
Insert the phrases that are missing to complete the graph description:
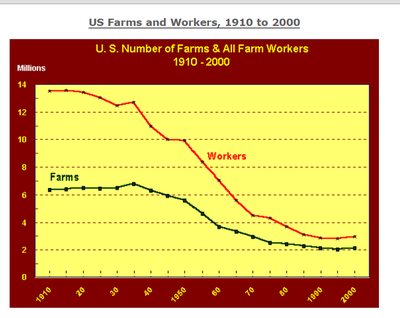
[blank_start]The graph shows changes in the number of[blank_end] farms and farm workers in the USA between 1910 and 2000. Overall, there was a huge drop in the number of workers and farms over the period.
[blank_start]The biggest change was in the number of[blank_end] farm workers. In 1910 there were almost 14 million agricultural workers in the US. This number remained relatively stable for twenty years, dropping only to about 13 million in 1930. [blank_start]However, between 1930 and 1975[blank_end] the number of labourers plunged. It fell from 13 million in 1935 to just over 4 million in 1975, a drop of about 66%. From 1970 to about 1990 the number continued to decrease, and from 1990 numbers appeared to level off at about 3 million.
The number of farms [blank_start]followed a similar decline[blank_end]. Between 1910 and 1940 the number of farms remained usually at about 6.5 million. After 1945, the number started to drop. It fell from 6 million in 1945 to just under 3 million in 1975, a fall of 50%. In the last twenty years of the century;however, the number remained stable at just over 2 million.
[blank_start]In conclusion, the number of[blank_end] farms and workers in America plummeted [blank_start]over the 100 year period[blank_end].
Answer
-
The graph shows changes in the number of
-
The biggest change was in the number of
-
However, between 1930 and 1975
-
followed a similar decline
-
In conclusion, the number of
-
over the 100 year period
Want to create your own Quizzes for free with GoConqr? Learn more.