858606
Question 1
Question
In August 2000, the World Health Organisation said that a 10 % increase in cigarette prices worldwide would reduce consumption of cigarettes by 4 % in high-income countries and by 8 % in low-income countries.
The above statement suggests that....
Answer
-
Smokers in high-income countries are twice as addicted to cigarettes as those in low-income countries.
-
Demand for cigarettes is price elastic in both low-income and high-income countries.
-
Income elasticity of demand for cigarettes is higher in low-income countries than in high-income countries.
-
Price elasticity of demand for cigarettes is negative in both high-income and low-income countries.
Question 2
Question
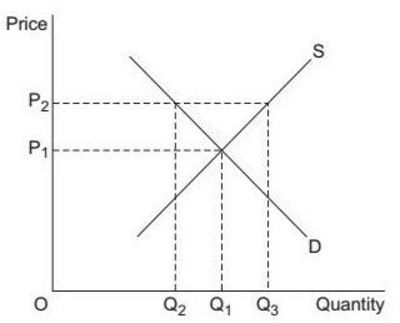
The diagram shows the demand and supply curves for wheat in the European Union (EU).
The free market price of wheat is OP1. It has been agreed as part of the Common Agricultural Policy (CAP) to maintain a price of OP2 within the EU and to do so through intervention buying. In achieving a price of OP2, the amount spent on intervention buying by the EU would be....
Image:
Untitled4 (image/jpg)
Answer
-
OP1 x OQ1
-
OP2 x OQ2
-
OP2 x Q2Q3
-
OP2 x OQ3
Question 3
Question
In July 2007, smoking in enclosed public places in England became illegal.
Such a policy would inevitably lead to government failure if
Answer
-
The government’s tax revenue from cigarette sales fell.
-
The economic benefits arising from the ban were outweighed by its costs.
-
Some people continued to smoke cigarettes in their own homes.
-
Jobs were lost in the tobacco industry.
Question 4
Question
The table below shows the shares of disposable income in an economy for five income groupings, as a percentage of the total, for the period 2004 to 2009.
From the data it can be concluded that....
Image:
Untitled5 (image/jpg)
Answer
-
Over the period shown all income groups, except the Top 40%, experienced a fall in their disposable income.
-
Between 2007 and 2009 there was a small increase in inequalities of disposable income.
-
Between 2004 and 2009 the rich became poorer and the poor became richer.
-
Total disposable income remained constant over the entire period shown.
Question 5
Question
A pure public good (or service) is always....
Answer
-
Provided by the government for all consumers.
-
Provided free of charge for all consumers.
-
Available for consumption by others when consumed by an additional person.
-
Heavily subsidised by the government.
Question 6
Question
In a buffer stock scheme....
Answer
-
An organisation might buy in the open market to maintain a minimum price in the market for a product.
-
Governments restrict supplies of a product coming onto an open market in order to lower prices of the product.
-
Buffer stocks are kept to sell if the price of a product starts to fall.
-
Buffer stocks are sold when there are surpluses in the market.
Question 7
Question
The cross elasticity of demand between two complementary products is always....
Answer
-
Negative
-
Positive
-
Zero
-
Greater than 1
Question 8
Question
Which one of the following is an appropriate form of government intervention for the problem identified?
Answer
-
The introduction of pollution permits to limit positive externalities
-
The use of a buffer-stock scheme to stabilise the price of a public good
-
The imposition of a maximum price for a merit good
-
The provision of a subsidy for a product which generates negative externalities
Question 9
Question
Which one of the following is associated with a missing market?
Answer
-
A monopoly restricting output
-
The production of a negative externality
-
A firm deciding to produce a private good
-
A government subsidising agricultural production
Question 10
Question
‘Electricity suppliers are required to buy a growing amount of electricity from renewable
energy generators. By 2010, this must amount to at least 10 per cent of total electricity bought from all generators. Green energy generators are paid more for their electricity because there is a scarcity of supply of electricity generated from renewable resources.’
It can be deduced from the data above that....
Answer
-
the government is subsidising the production of renewable energy.
-
the social cost of electricity generated from renewable resources is greater than the private cost.
-
the government is subsidising the negative externalities arising from the production of ‘green energy’.
-
electricity suppliers are paying higher average prices for their electricity because some of the electricity is generated from ‘green sources’.
Question 11
Question
The income elasticity of demand for bus travel is − 1.5. This means that....
Answer
-
a 10% increase in fares will lead to a 15% decrease in passengers.
-
bus travel is an inferior good.
-
bus travel has a negative cross elasticity of demand.
-
as unemployment falls, more people will use buses.
Want to create your own Quizzes for free with GoConqr? Learn more.