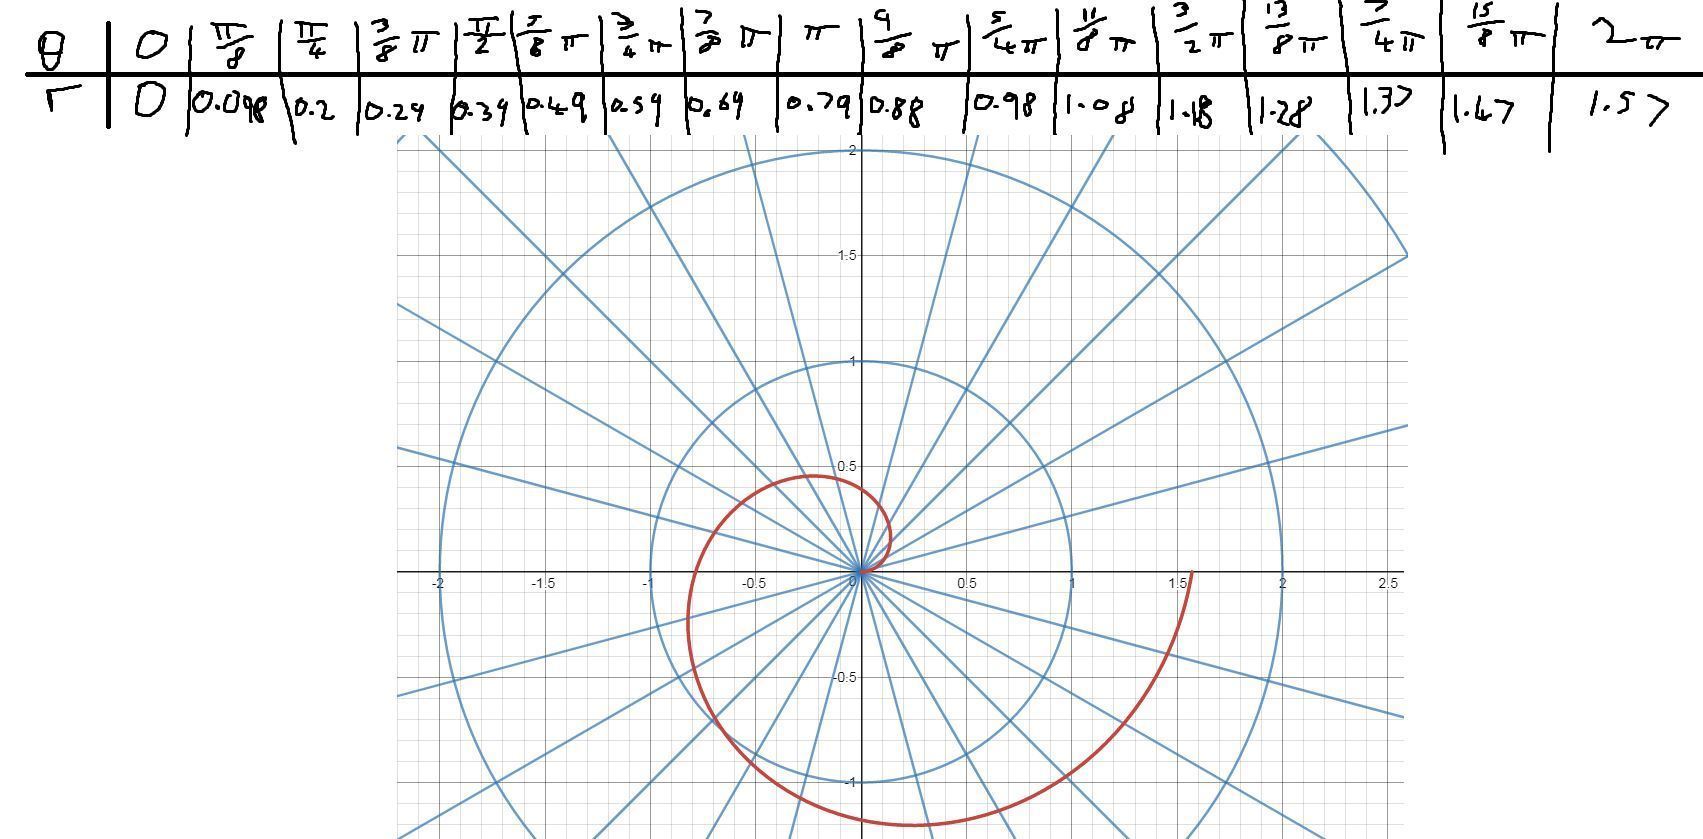
Question: Plot a graph or 4r=θ
Firstly, we should rewrite this in terms of r alone, so r=θ/4
Second, we should find our values of r from 0 to 2π. To do this we could use the table function on the calculator and input: f(x)=x/4 , g(x)=0 , Start: 0 , End: 2π , Step: π/8 (note that x=θ). The table we get is on the left
Finally, we plot our graph. We have to indicate a scale per circle (this is already labeled on our graph)
Note that this particular graph could continue on past 2π.