
Option Series: Session III

Slides in this set (24)
-
- Topics Included in Session III
- Recap of Session II
- Option Chain - In Depth
- Stock Quotes
- Bid. Ask, & the Spread
- Fundamental Analysis
- Technical Analysis
- Charting
- Trends
- Support & Resistance
- Pivot Points
-
- In Session II, you saw why trading options could be more lucrative than trading stocks and reviewed a standard option chain.
- You also looked at a few live trades to understand how they resulted in profit. At the same time, a few of the charts associated with the trades were presented to show how the value of the option was derived from the value of the stock. In this session, we will look at options chains and charting more in depth.
-
- The option chain shows the available call and put options, the listing of strike prices for a specific underlying security on various expiration dates, and the current quotes from buyers and sellers.
- Depending on the online brokerage service that you use, the interface may be slightly different but in general, the layout and available information should be very similar.
- Broker platforms offer settings for you to modify the columns and select only the details that you wish to see. Free website that have option chains have standard columns but typically provide all of the information you need.
- The video will show several free options.
- Elite Iivii Meeting 20180521 1407 4 (video/mp4)
-
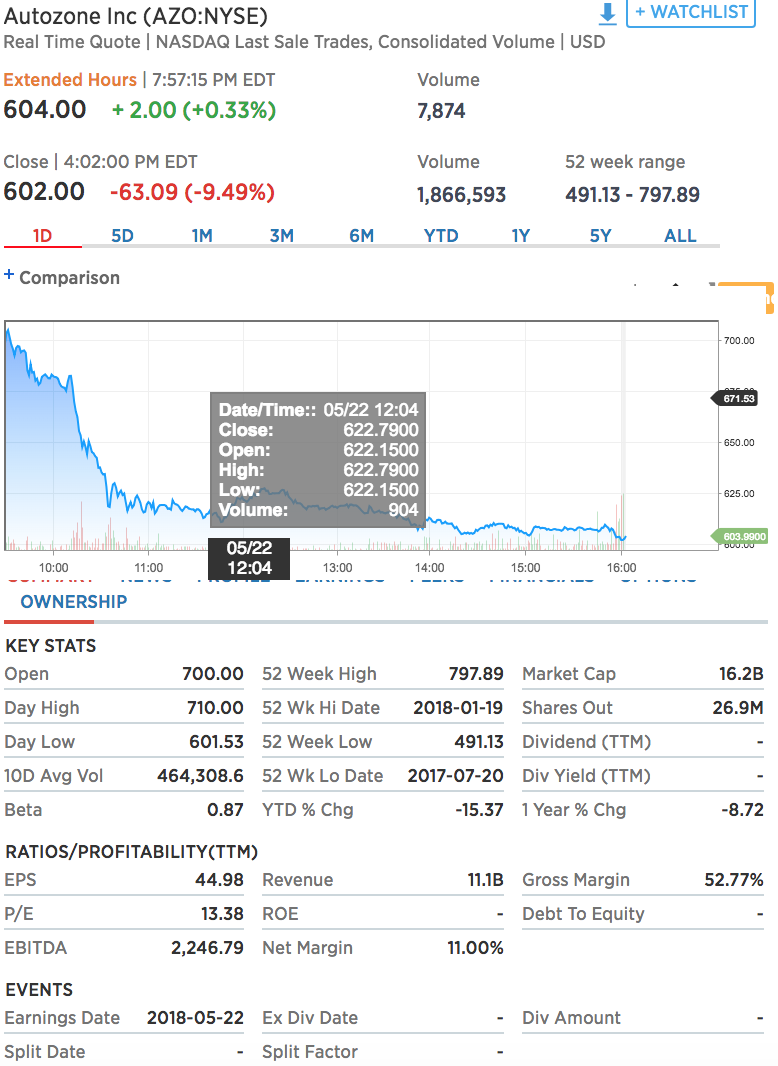
- A stock quote is the price of a stock as quoted on the exchange. Stock quotes update in real-time as the stock is bought and sold through-out a trading session. A stock quote is also made up of other stats that help the buyer make an informed investment decision.
- When you look up a stock quote, there a variety of numbers, prices and diagrams that will appear. Understanding what they all mean will help you make an informed decision when purchasing a stock.
- Last Price - The most recent price that the stock has traded at. The last price, however, is not the price you will be paying for the stock.
- Bid - The highest price a buyer is currently willing to pay for a stock.
- Ask - The lowest price at which a seller is currently willing to sell the stock at. When placing a market order, you are buying or selling a stock at the best available price.
- Today's Change - The change in price (and the percentage change) compared to yesterday's closing price.
- Previous Day's Close - This is the price of the stock for the last trade of the previous day.
- Today's Open - The first price at which this stock traded when the markets opened this morning. Note that stocks do not open at the same price that they closed at the day before due to after hours trading.
- Volume - This indicates the number of shares that have traded hands today. Some stocks may trade millions of shares each day, and others only trade a few hundred or even zero (the higher the volume, the more liquid the stock is).
- 52 Week High - This is the highest price the stock has traded at during the last 52 weeks.
- 52 Week Low - This is the lowest price the stock has traded at during the last 52 weeks. The 52 week high/low allow you to compare the current price to its 52-week range.
- Stock charts come in a variety of formats and have a whole investing technique based around them. They all track pricing data, usually the OHLC (open, high, low close), but they can display this information in different styles (lines, bars, candlesticks), different date ranges (day, week, month, year, 5 years, 10 years) and other information like volume, moving averages and dozens of other indicators.
- Annual Dividends - The amount, in dollars, the company will (but not obligated) pay to shareholders on a regular basis (usually monthly or quarterly).
- Annual Dividend Yield - This is an important measure of return of the stock and is calculated by dividing the annual dividend amount by the current stock price. If the stock is at $10 and the company pay out a cash dividend of $0.50 per share, then the annual dividend yield is 5%.
- EPS - Displays the company's earnings (profit) per share. It is calculated by dividing the company's most recent annual income by the number of shares outstanding.
- Market Cap (aka Market Capitalization) is the total dollar market value of all of a company's outstanding shares. Market cap is calculated by multiplying a company's shares outstanding by the current market price of one share. This figure determines the company's relative size.
- Price-Earnings Ratio (P/E) Is the ratio for valuing a company and measures its current share price relative to its per-share earnings.
- Beta is used to measure the volatility of a stock as compared to the market as a whole. A beta of 1 means the stock moves up or down more quickly than the market overall; a beta between 0 and 1 means the stock doesn't move as much as the market, and a negative beta means the stock moves in the opposite direction of the market.
- Caption: Click to Enlarge
-
- If you are at the very beginning of your trading journey, you may be unaware that securities (stocks, options, etfs, etc.) actually have two prices at all times! Crazy.... I know.
- The two prices are called the "Bid" and the "Ask".
- In my opinion, the market works like a combination of eBay and an auction, there is a large supply product with multiple buyers and sellers making offers.
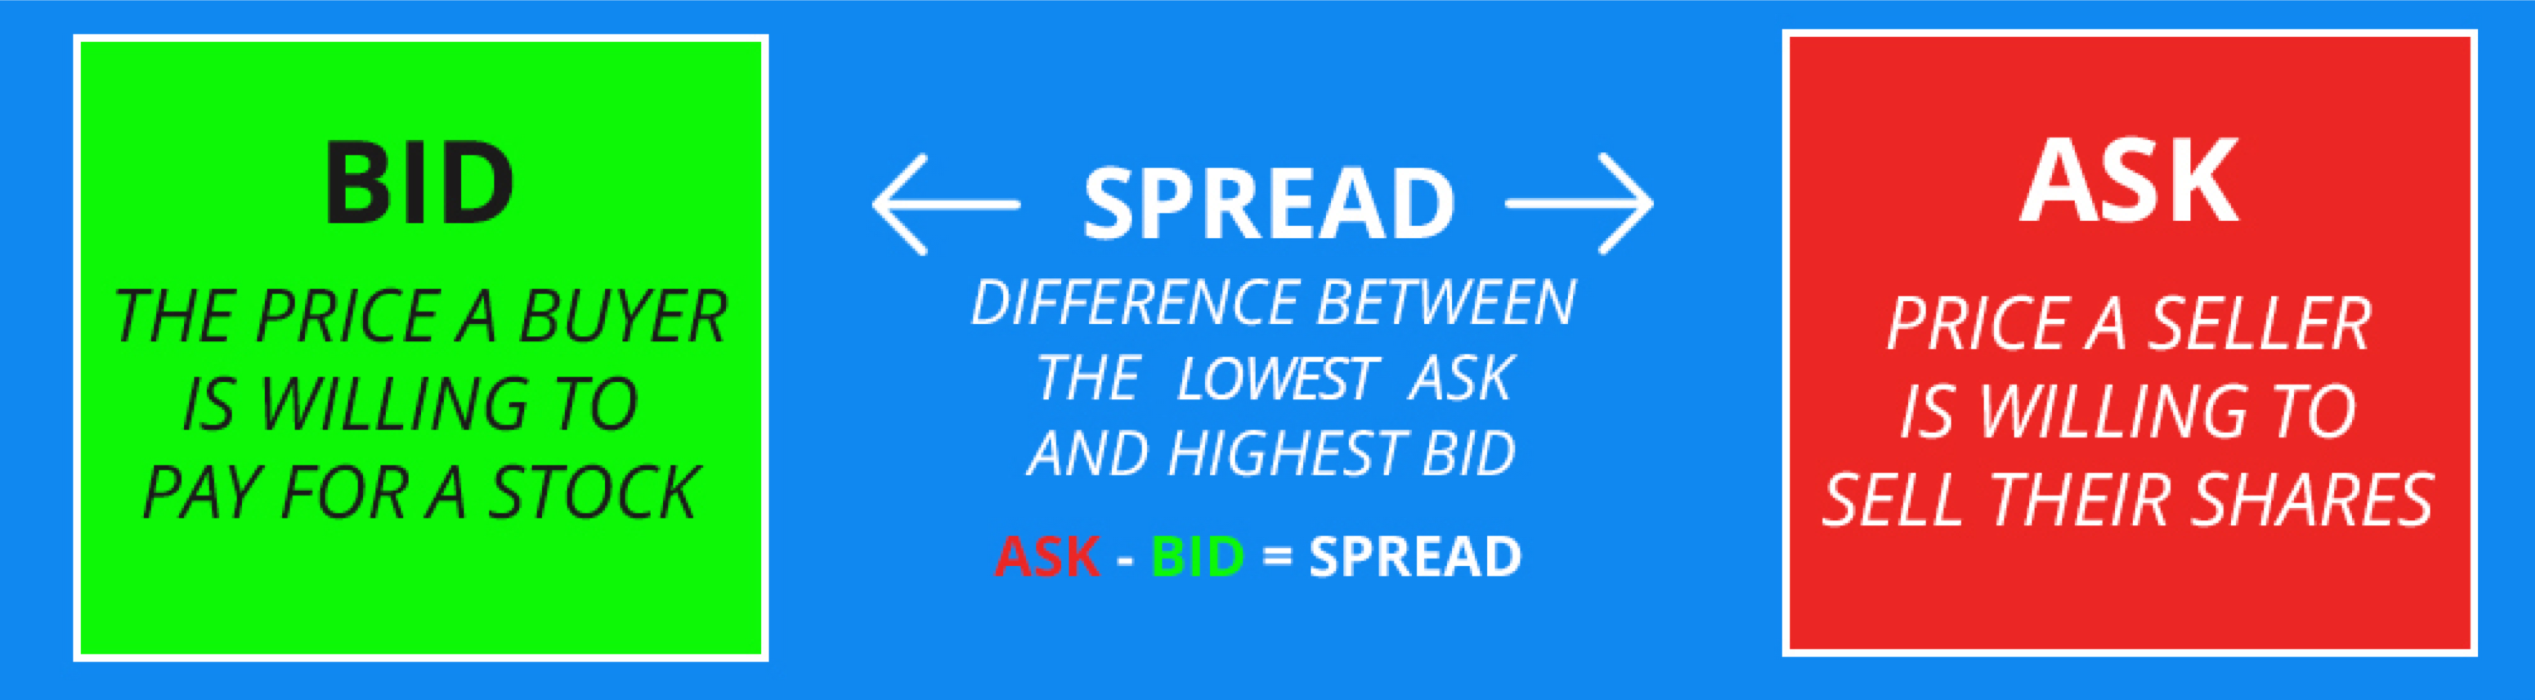
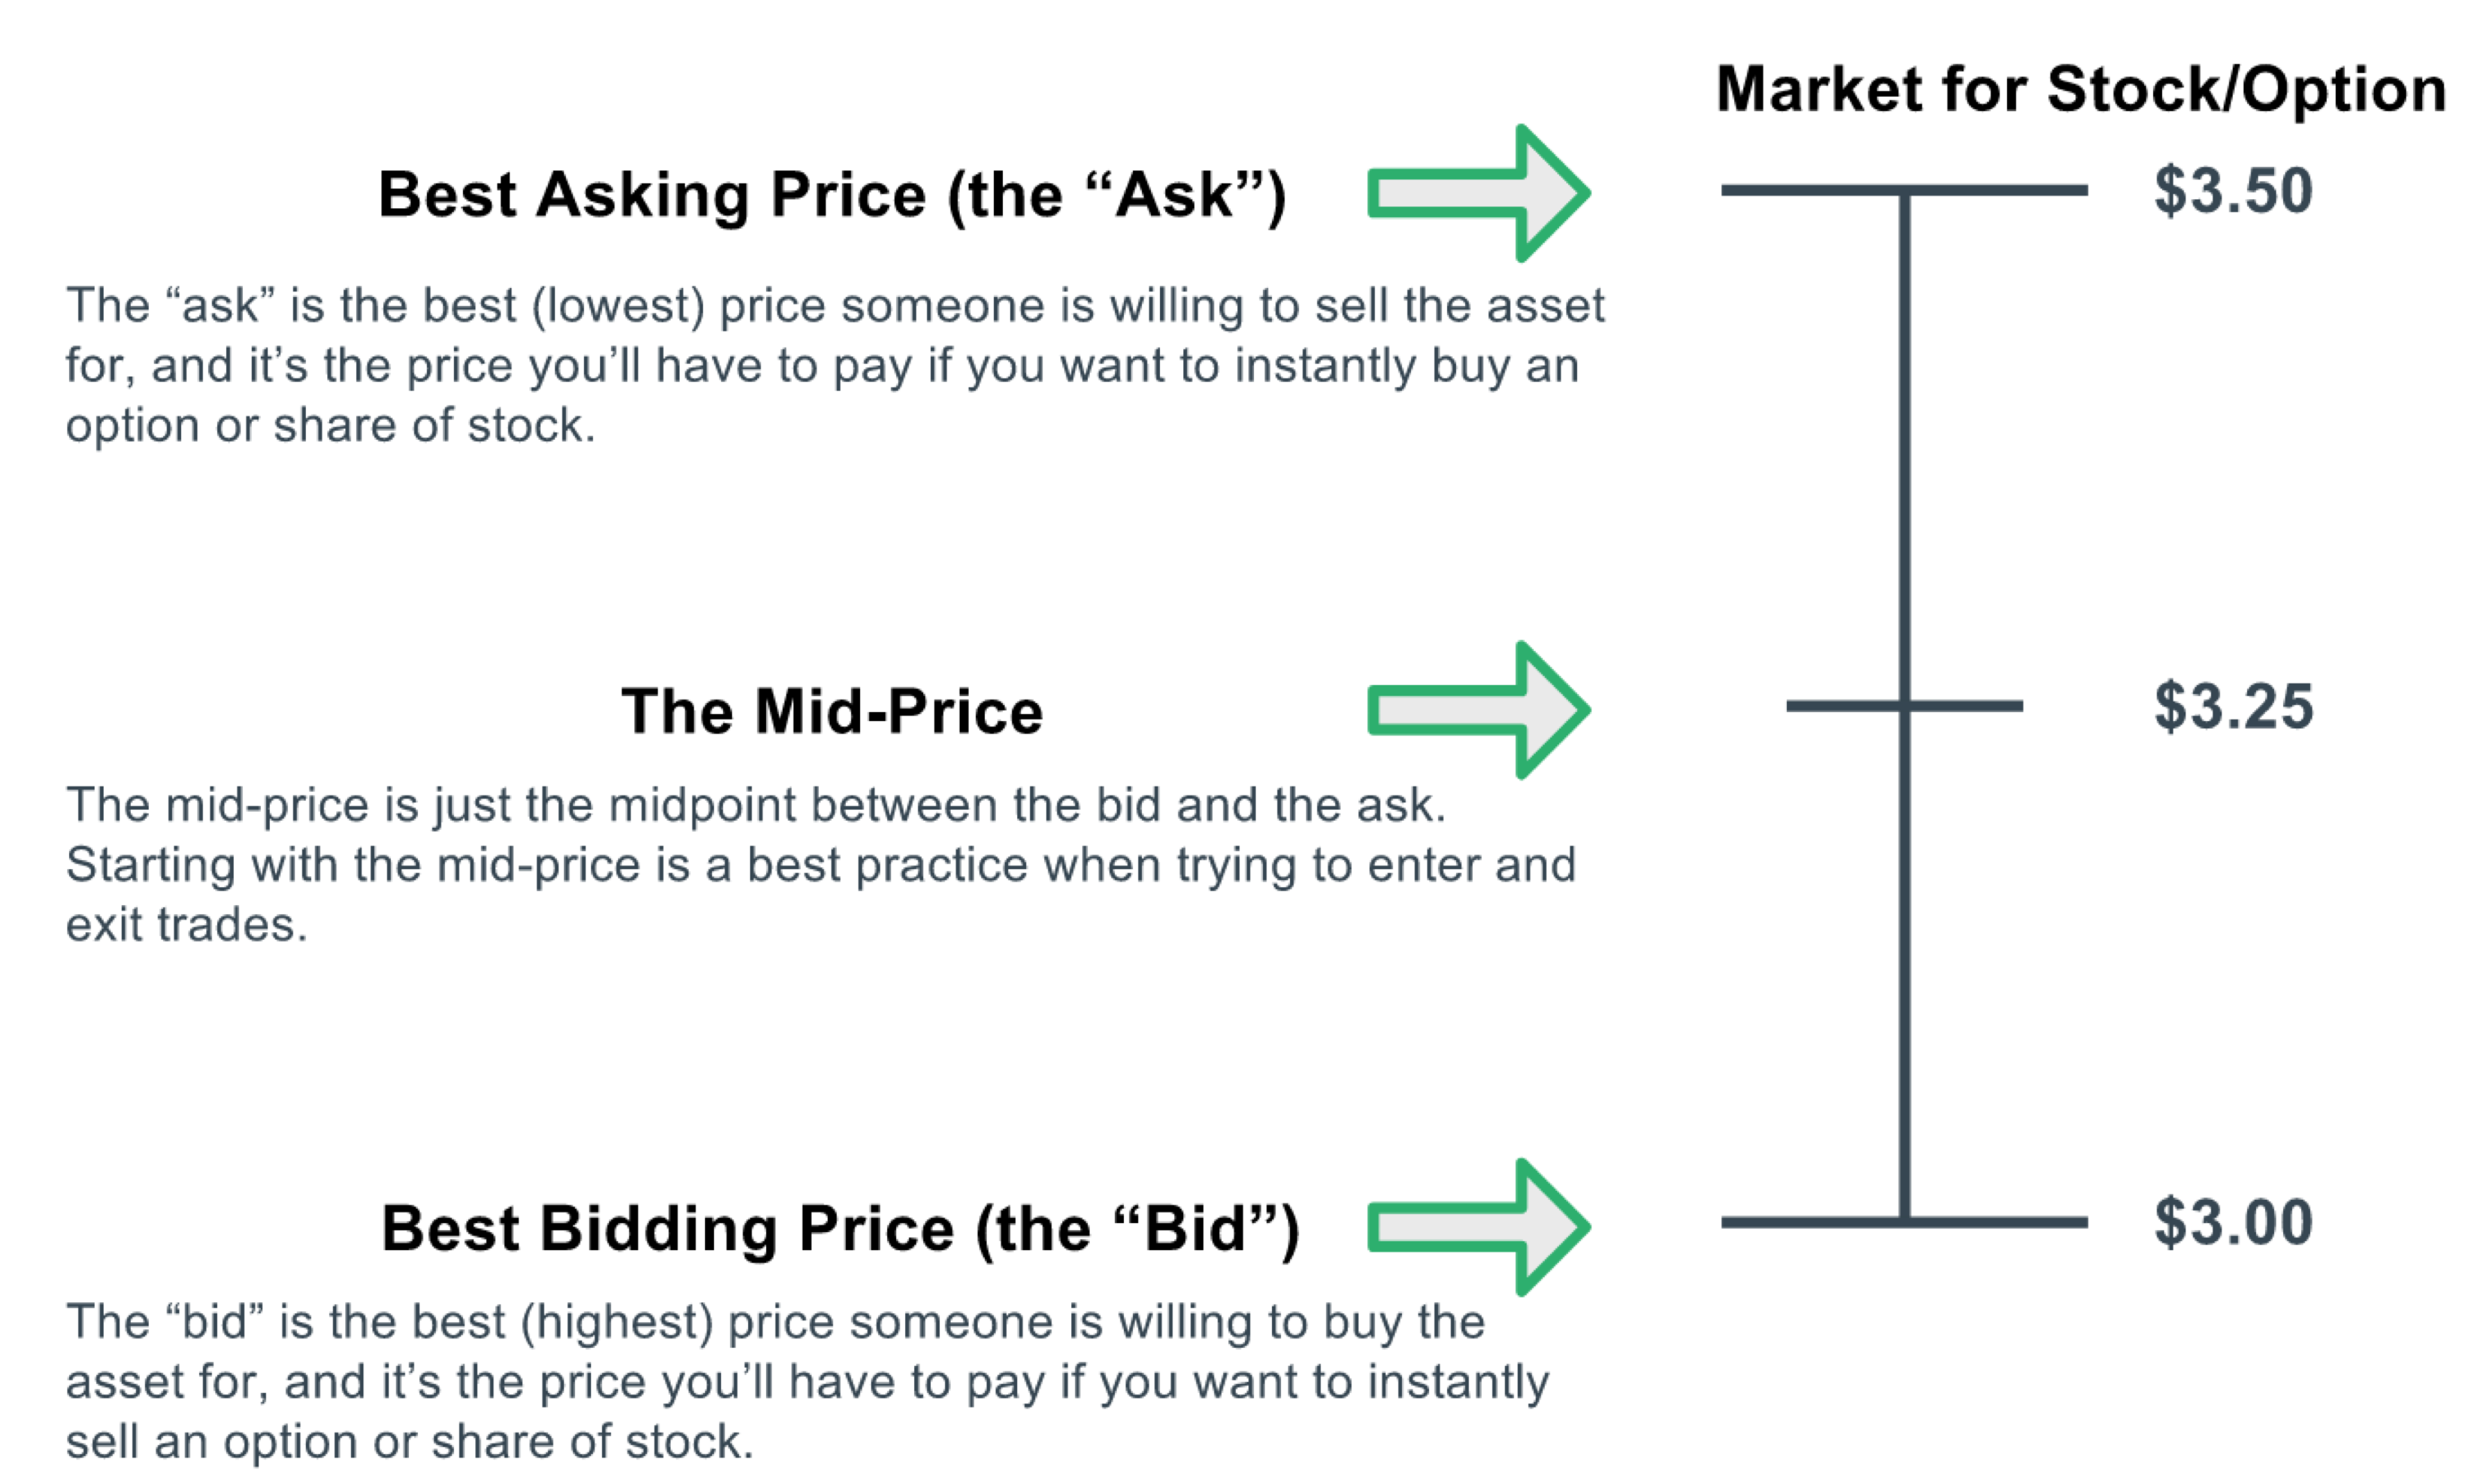
- Bid price is the highest offer that a buyer has made for a particular security. The option chain will always show the highest offer for a Bid.
- Ask price is the lowest price/offer that a seller is willing to sell that security for. Ask price is also referred to as “offer price”.
-
- The difference in price between the Bid and Ask is called the Bid Ask spread. The bid-ask spread is essentially the difference between the highest price that a buyer is willing to pay for an asset and the lowest price that a seller is willing to accept to sell it.
- For example, if the bid price for the stock is $19 and the ask price for the same stock is $20, then the bid-ask spread for the stock in question is $1.
- The bid-ask spread is a reflection of the supply and demand for a particular asset. The bids represent the demand, and the asks represent the supply for the asset.
- As a general rule, the lower the open interest, the wider the bid-ask spread. Furthermore, near the money options usually have higher open interest and hence better liquidity and narrower bid-ask spreads.
-
-
- The more freely a security changes hands, the more “liquid” it is considered to be. Popular securities that trade in high volume are considered very liquid. And the more liquid a security is, the lower its bid-ask spread typically is. Popular securities that are highly liquid will often have a bid-ask spread that is less than a penny or two per share.
- Where bid ask spread can become troublesome is in two scenarios:
- When a security that trades at low volumes: with less buyers and sellers in the market, the bid-ask spread is typically higher, which makes it harder for sellers to match buyers at desired prices. You will find this is lightly traded securities. It’s not unheard of to see a bid-ask spread of 1% or greater of a security’s price.
- When there is a big discrepancy between supply and demand: this can create a big difference in bid-ask spread. You typically see this in times of high volatility, with rapid gains or declines in share value.
- These scenarios are worrisome because the bid-ask spread becomes a hidden trading cost that can total hundreds, if not thousands of dollars over the course of your lifetime. Even the wise process of re-balancing investments can become a money losing proposition each time you do it.
-
Bid & Ask: Where Do I Want to Buy In?
- When possible, and depending on the trading strategy being employed, it’s ideal to get the best price possible. As a standard, I recommend trying to land right in the middle of the Bid and Ask Price.... sometimes called the Mark or the Mid.
- If it’s likely you’ll get filled on the Bid side, because the price is dropping, then it is best to buy at that lower price (the Bid) instead of unnecessarily paying the higher Ask price. Buying at the Ask price (or selling at the Bid price) is called “paying the spread.” If you do it on every trade, the amount it takes out of your profits can become significant. Be frugal and try to get the best price whenever possible.
- That isn’t always the best option though. In fast-moving markets, where you need to get into or out of a position quickly you’ll likely need to “pay the spread” (buy at the offer or sell at the bid), because if you don’t you likely won’t get into or out of your position. Think of the Bid Ask Spread as a hidden trading cost. It can work against you, if you always have to pay it. On the other hand, it can work for you in the way of slightly increased profits if you pick your entry points carefully.
-
- 1.The bid-ask spread indicates how much money a trader will lose by purchasing at the asking price and selling at the bidding price.
- 2.Wider bid-ask spreads indicate less active trading products, as well as more significant losses from slippage.
- 3.Shares of stock tend to have very narrow bid-ask spreads, while options tend to have wider bid-ask spreads. So, try to only trade options that have bid-ask spreads less than $0.10.
- 4.Deep-in-the-money options and options with more time until expiration tend to have the widest bid-ask spreads.
- 5.At-the-money and out-of-the-money options tend to have the smallest bid-ask spreads because at-the-money options are the most actively traded contracts, and out-of-the-money options are the cheapest (thereby setting a floor on how wide the bid-ask spread can be).
- 6.When markets become more volatile, bid-ask spreads tend to widen significantly.
-
Fundamental vs Technical Analysis
-
Fundamental Analysis: In Depth
- ADVANTAGES:
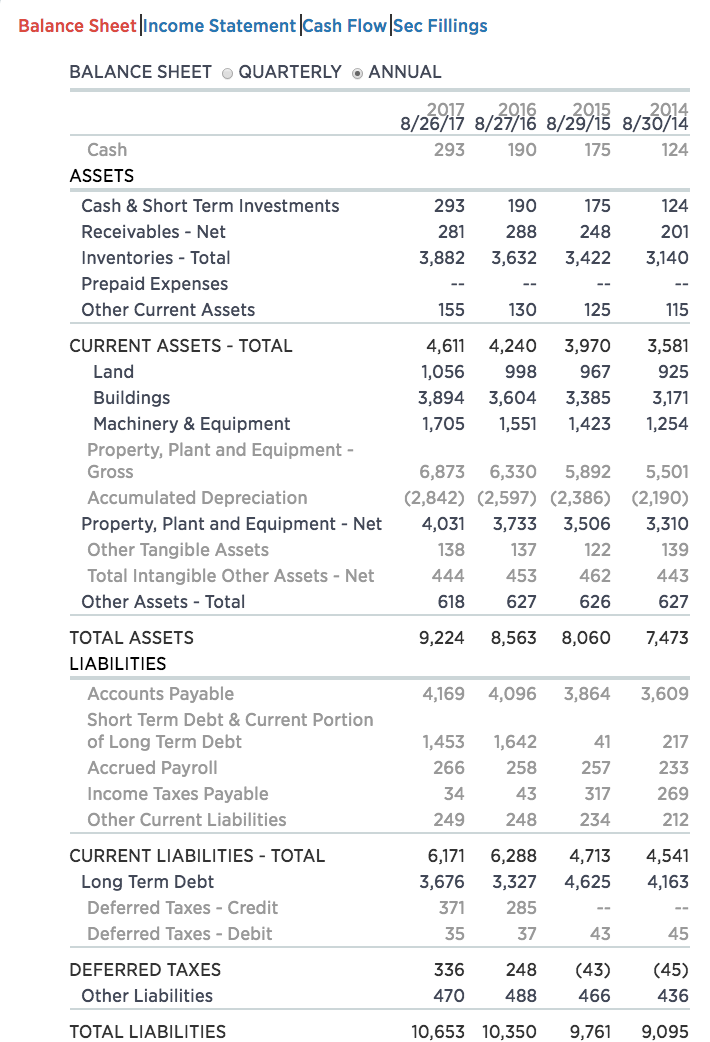
- Use of Analytical methods: The methods and approaches used in Fundamental analysis are based on sound Financial data. This eliminates the room for personal bias.
- 360 Degree Focus: Fundamental analysis also considers long term economic, demographic, technologic and consumer trends.
- Systematic approach for deducing the Value: The statistical and analytical tools used,help in arriving at a proper Buy/Sell recommendation.
- Better Understanding: Rigorous accounting and financial analysis, helps to gauge better understanding of everything.
- DISADVANTAGES:
- Time consuming: Carrying out Industry analysis, financial modeling and valuation, is not a cup of tea. It can get complicated and may need lot of hard work to start with.
- Assumptions-centric: Assumptions play a vital role in forecasting the financials. So it is important to consider the best and the worst case scenario. Unexpected negative economic, political or legislative changes, may cause problems.
-
- ADVANTAGES:
- Gives insights on Volume Trend: Demand & Supply governs the trading market. Thus, it tells you a lot about Traders Sentiments. You can actually judge how the overall market is working. Usually High demand push up the prices, and high supply push down the prices.
- Tells you when to Enter and Exit: Technical analysis is able to tell you when to enter or exit a trade.
- Provides Current Information: Price reflects all the known information about an asset. Prices may increase or decrease, but ultimately the current price is the balancing point for all information.
- Patterns give you direction: You can use patterns as a guide to direct your buy and sell decisions.
- DISADVANTAGES:
- Too many Indicators spoil the Charts: Too many indicators can produce confusing signals which may affect your analysis.
- Underlying Fundamentals ignored: Technical analysis does not take into account the underlying fundamentals of a company. This can prove risky in case of long time frames.
-
Where do you fall on the spectrum?
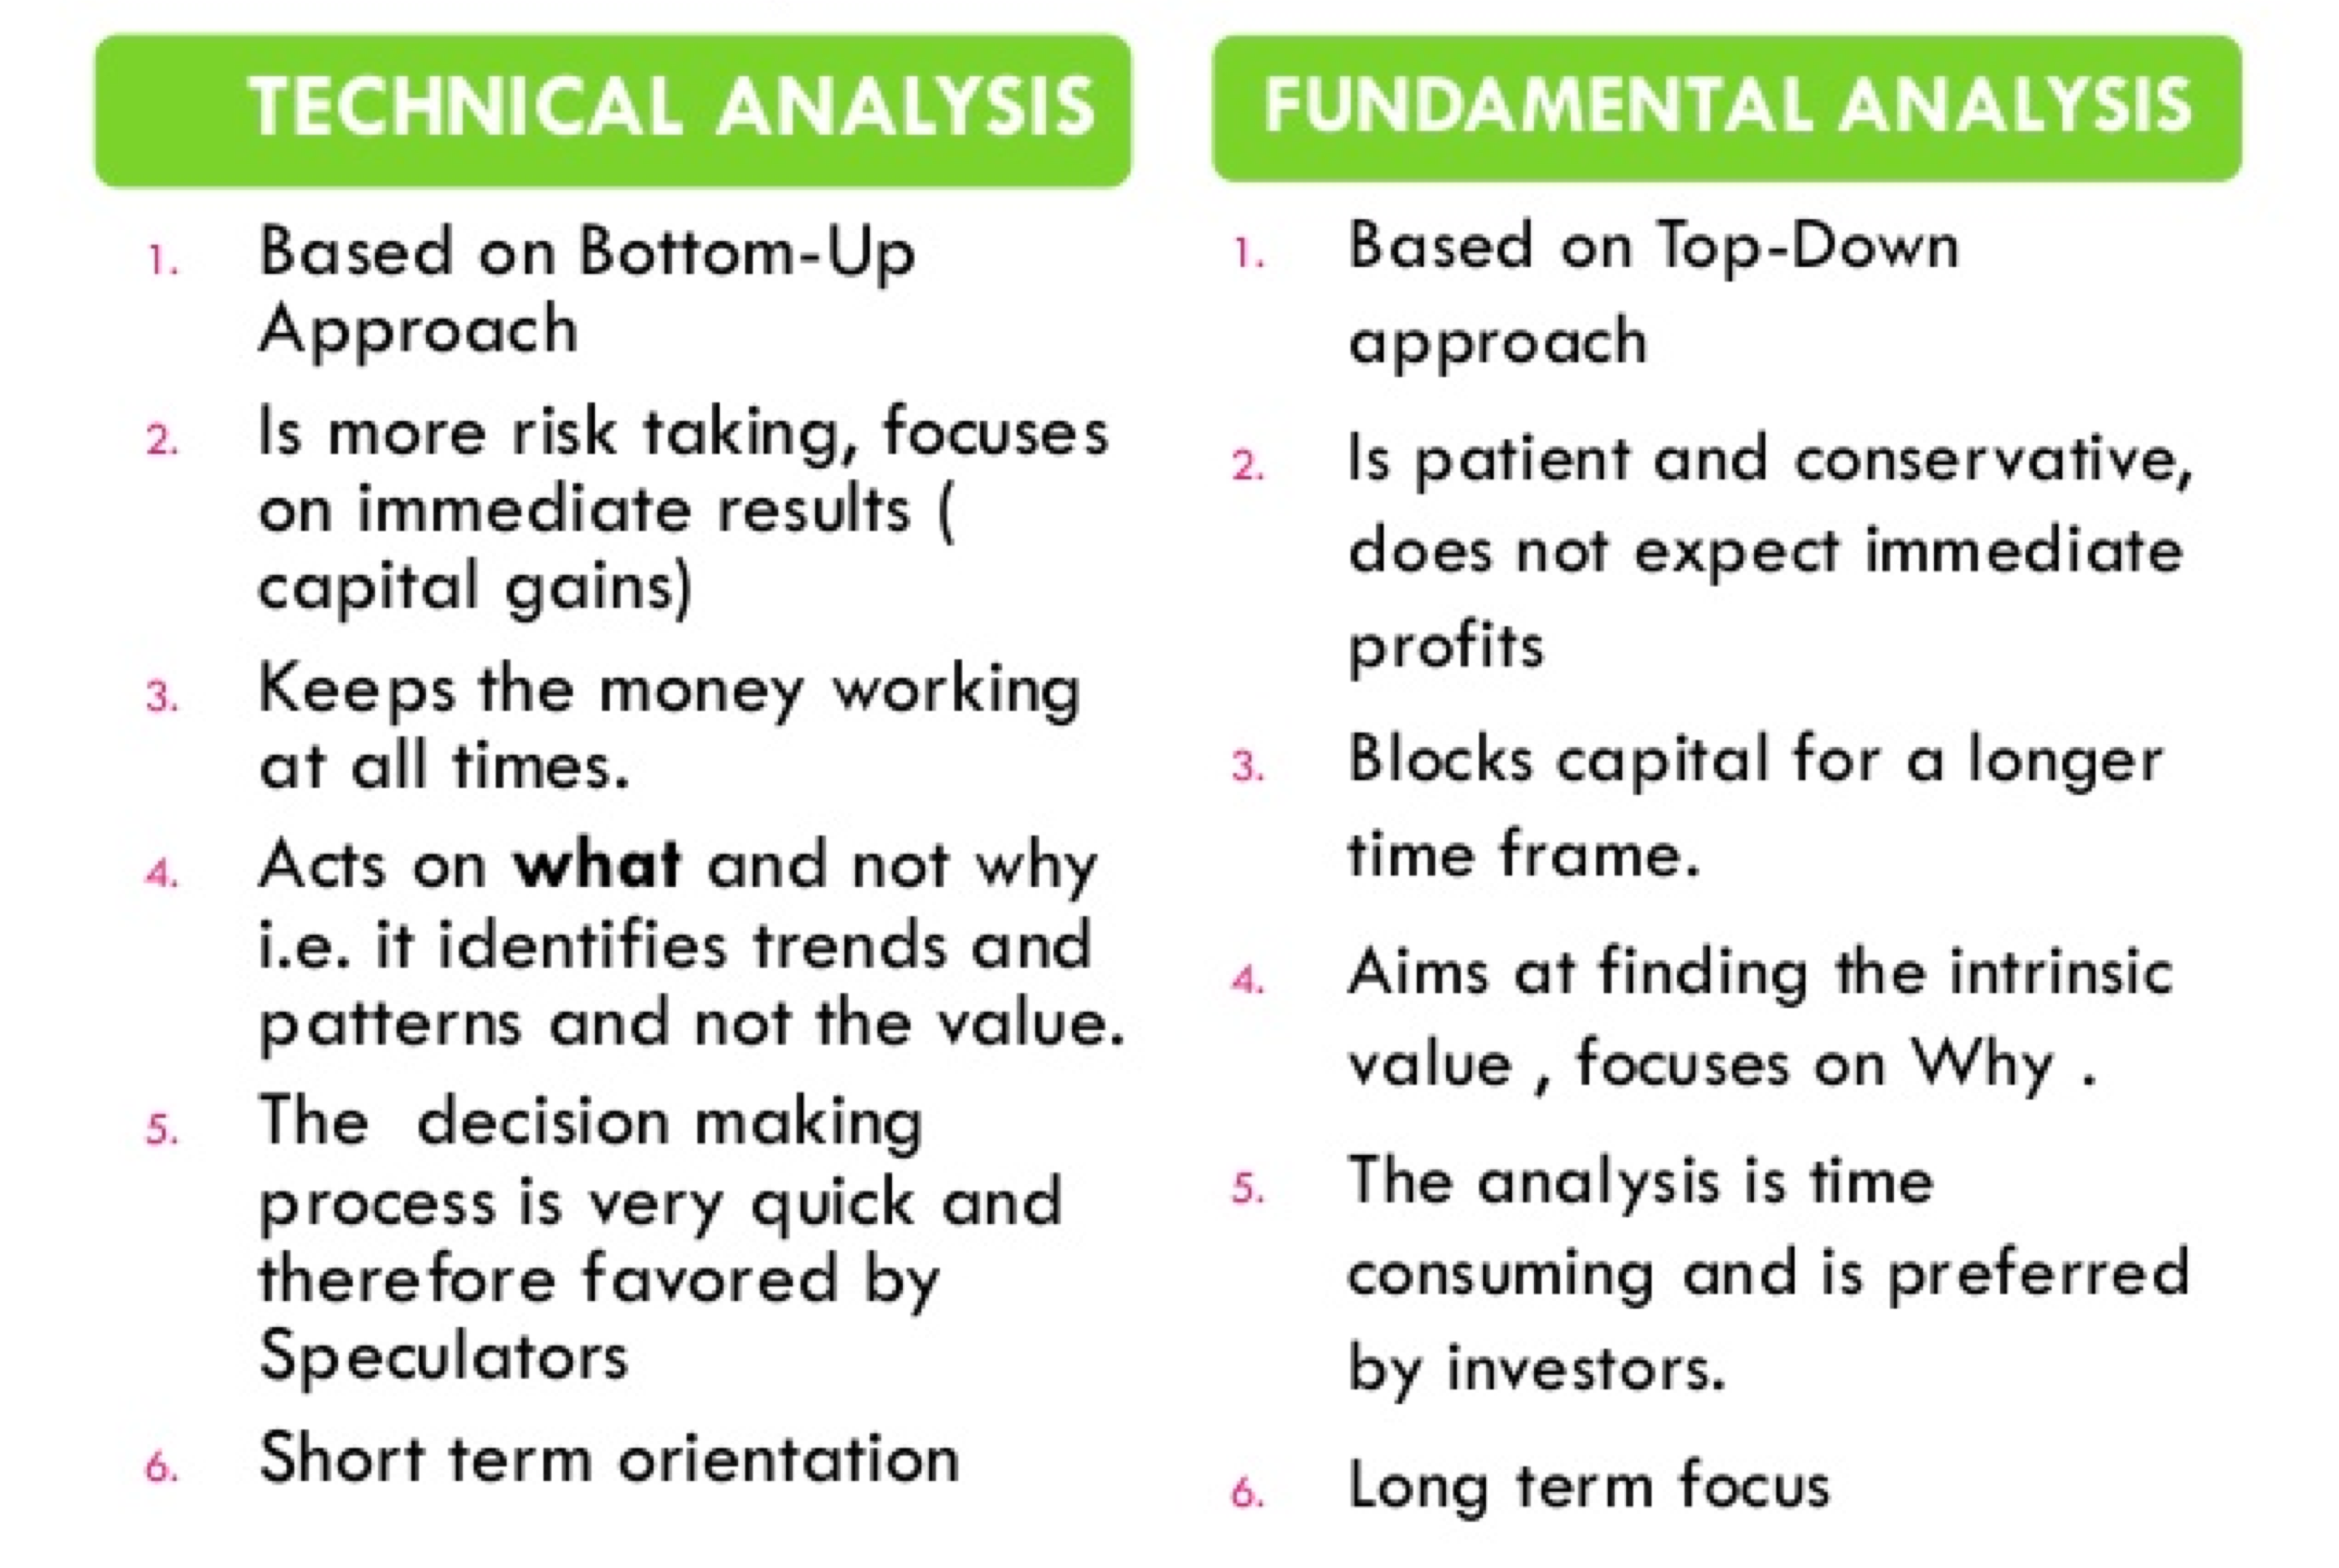
- Do you believe in reading charts, crunching data points, and looking at trends? If yes, then you have a mindset based on Technical analysis. Or do you believe in making investment decisions based on Financials, Growth and EPS? Well, then you have a mindset based on fundamental analysis!
- In truth, both types of analysis are extremely useful for examining market action. It’s just that they both have a different school of thought. Your trading style and attitude will determine the kind of analysis beneficial for you.
-
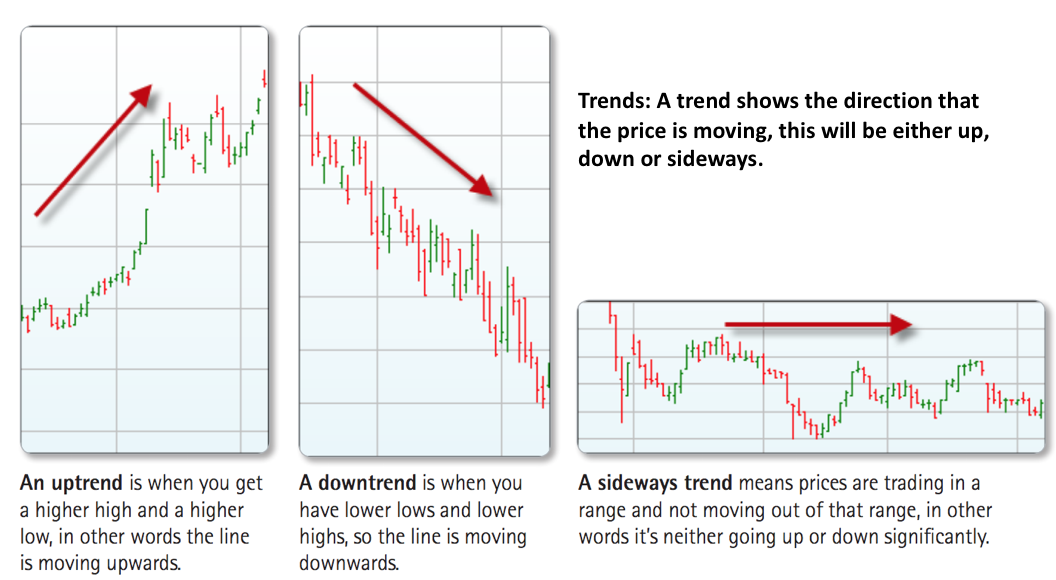
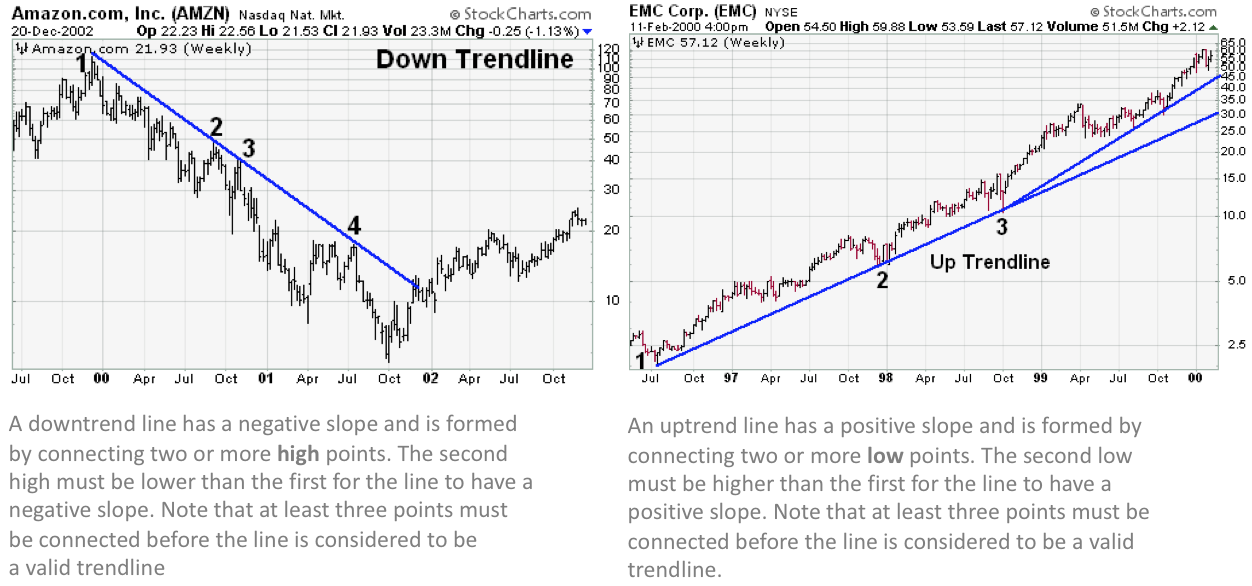
- The goal in our strategy is to buy options cheap and then sell at a higher price. To make a profit on a call, you want the stock's share price to trend upwards. This means you will be looking for companies that have the possibility of increasing in value. Of course, an uptrend does not guarantee that it will continue to go up forever. Sometimes the uptrend stops and sometimes shares that have fallen, bounce back. However, a steady uptrend is often a good sign. When looking at a trend, you should also be aware of the time interval – if you look at a chart covering a 3 month period you may see that the trend is up. However, if you look at the trend over a year, you might find that the overall trend is down.
-
-
-
-
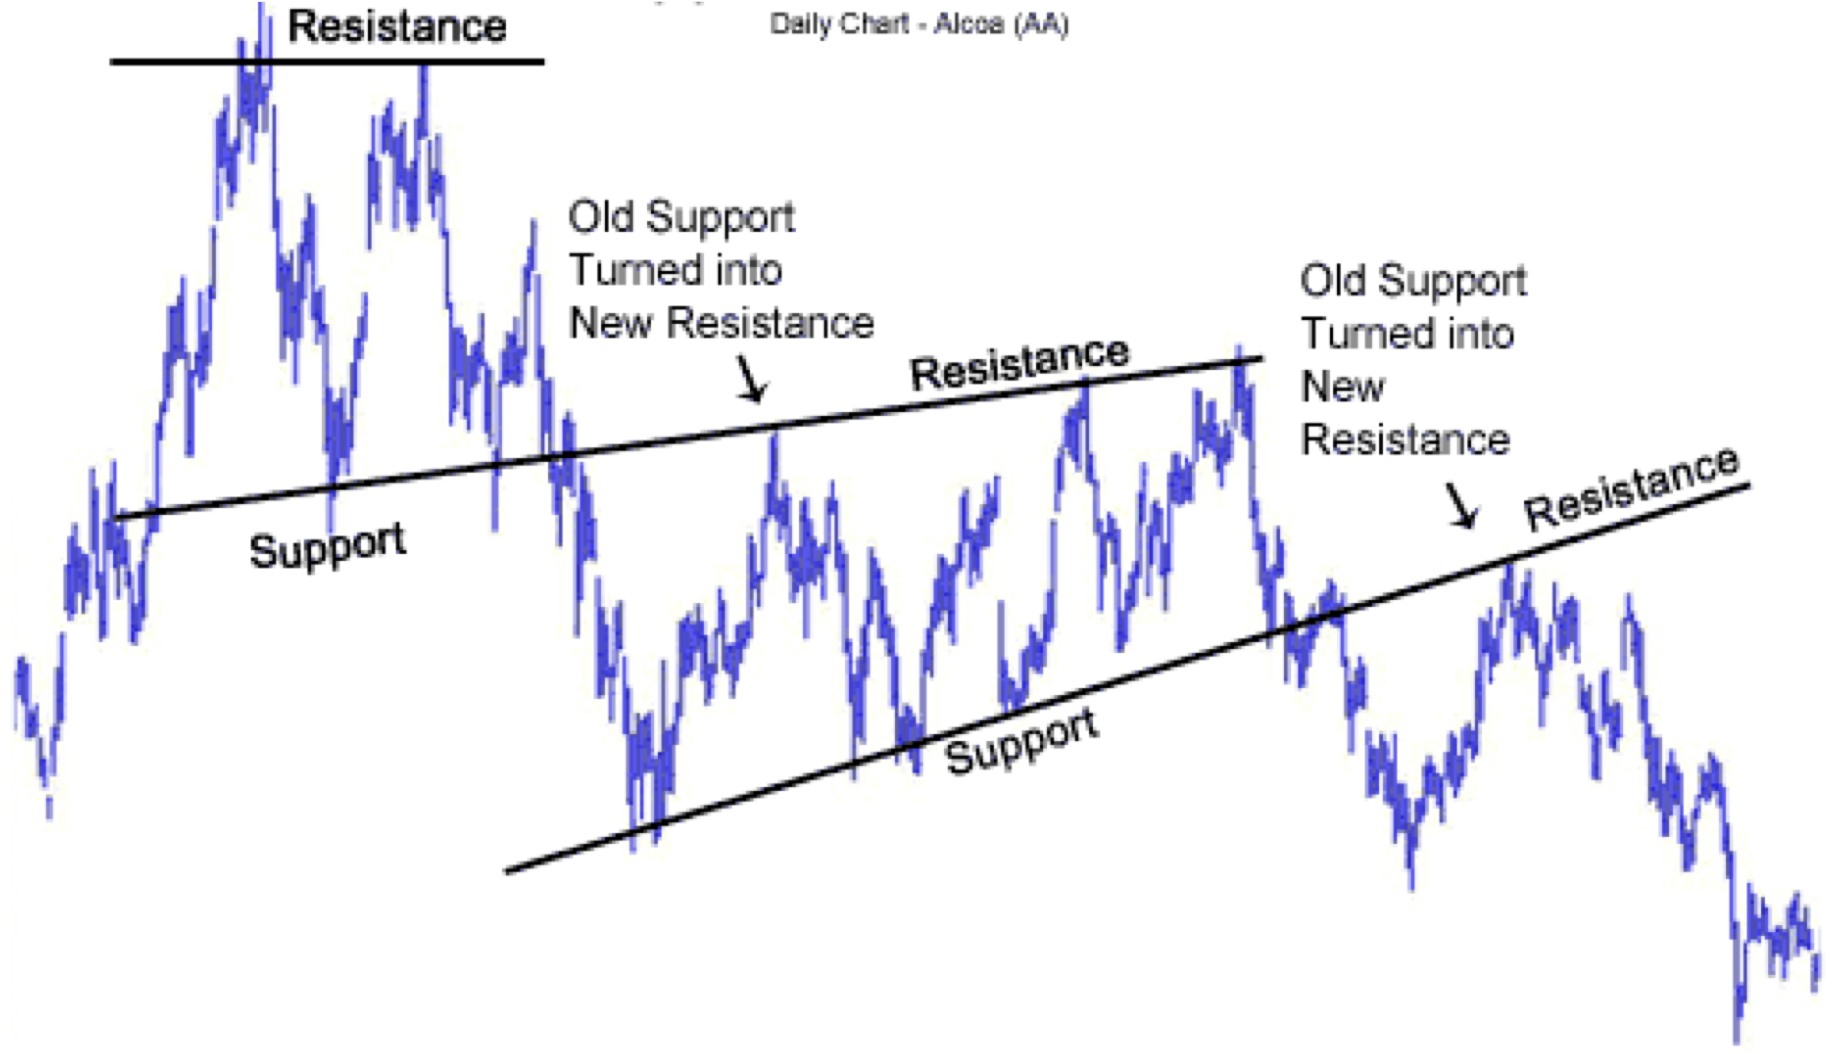
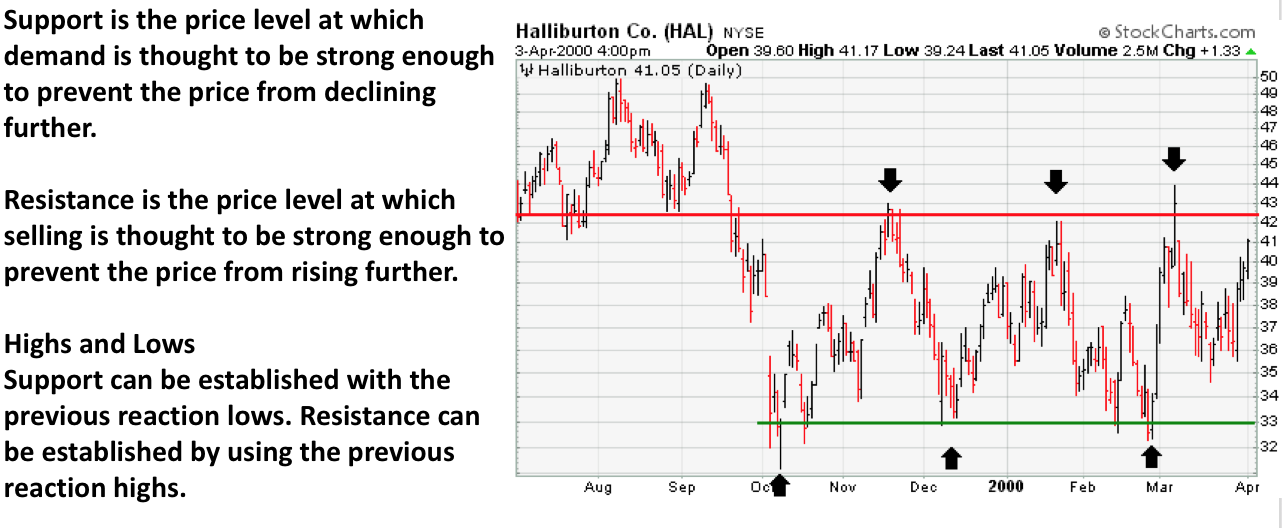
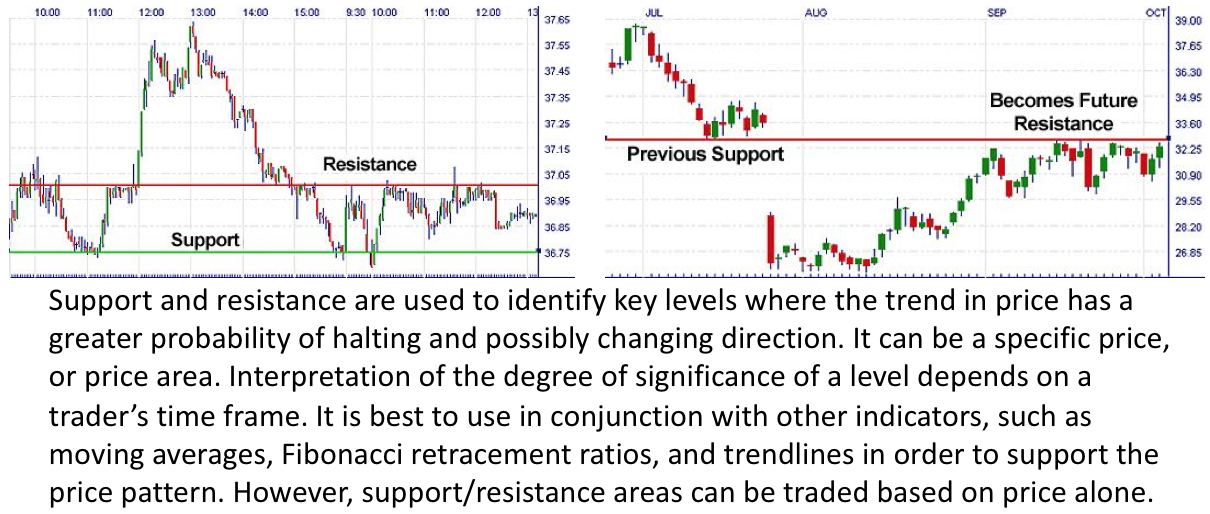
- A support level is where buyers step in and become more aggressive, therefore keeping price from going lower. As price declines towards support, selling pressure declines due to lower price, and buyers become more aggressive due to this lower price. A support level will eventually be broken and price will decline below it. That price will then become a future resistance level.
- A resistance level is where sellers step in and become more aggressive and, therefore, keep prices from going higher. As price rallies towards resistance, buying pressure declines due to higher prices, and selling pressure increases. A resistance level will eventually be broken and price will rise above it. That price will then become a future support level.
-
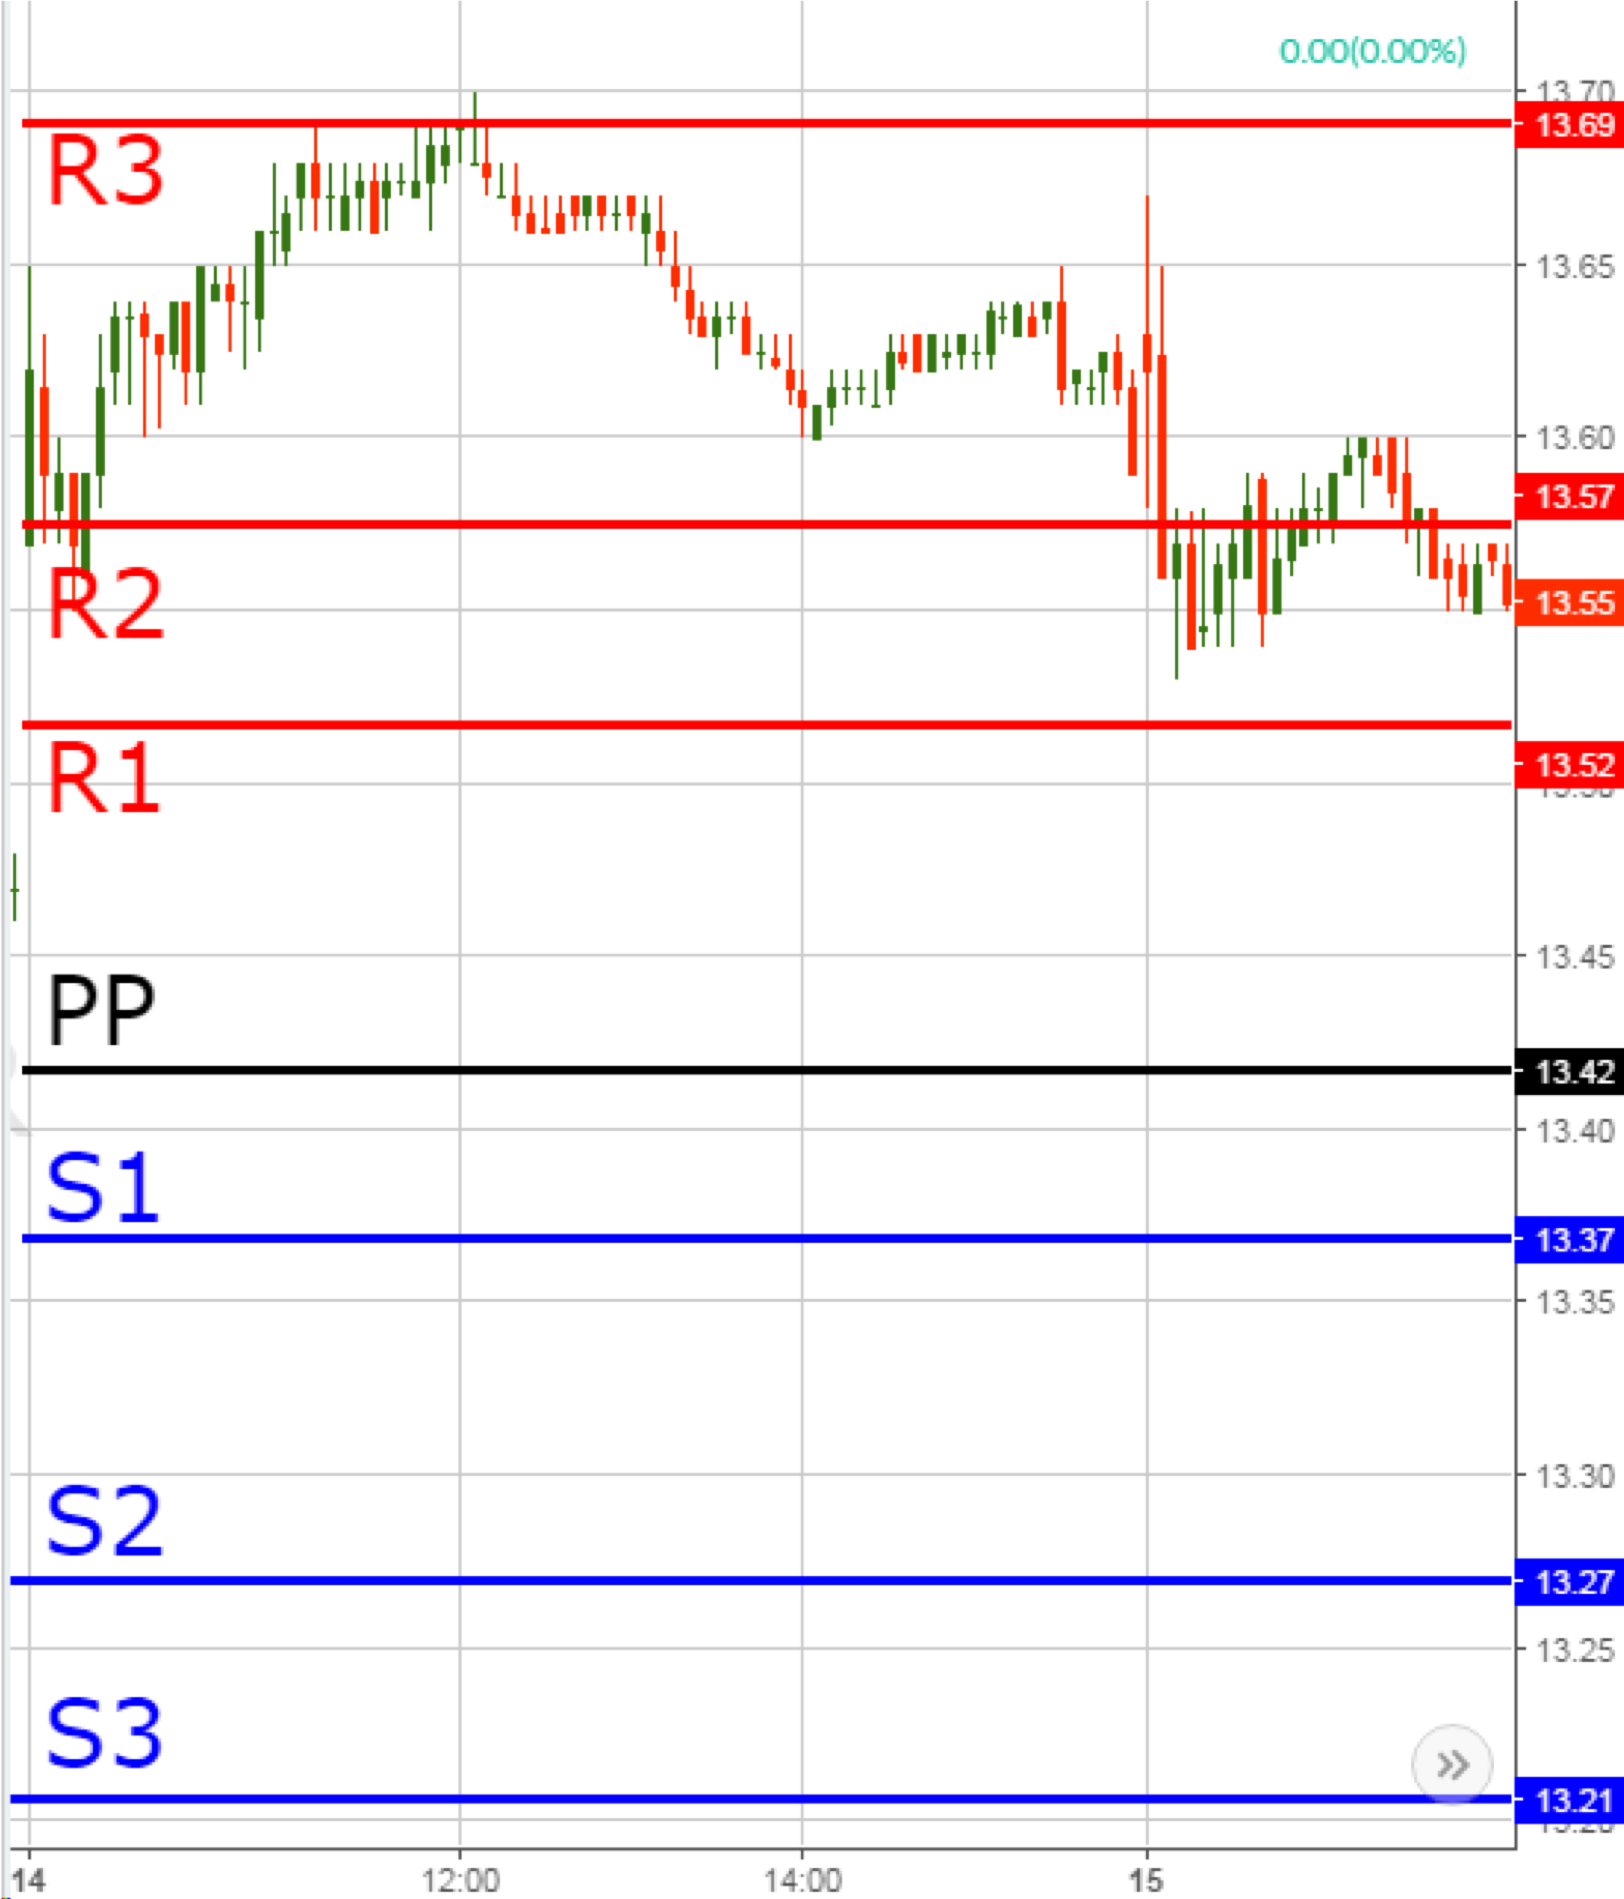
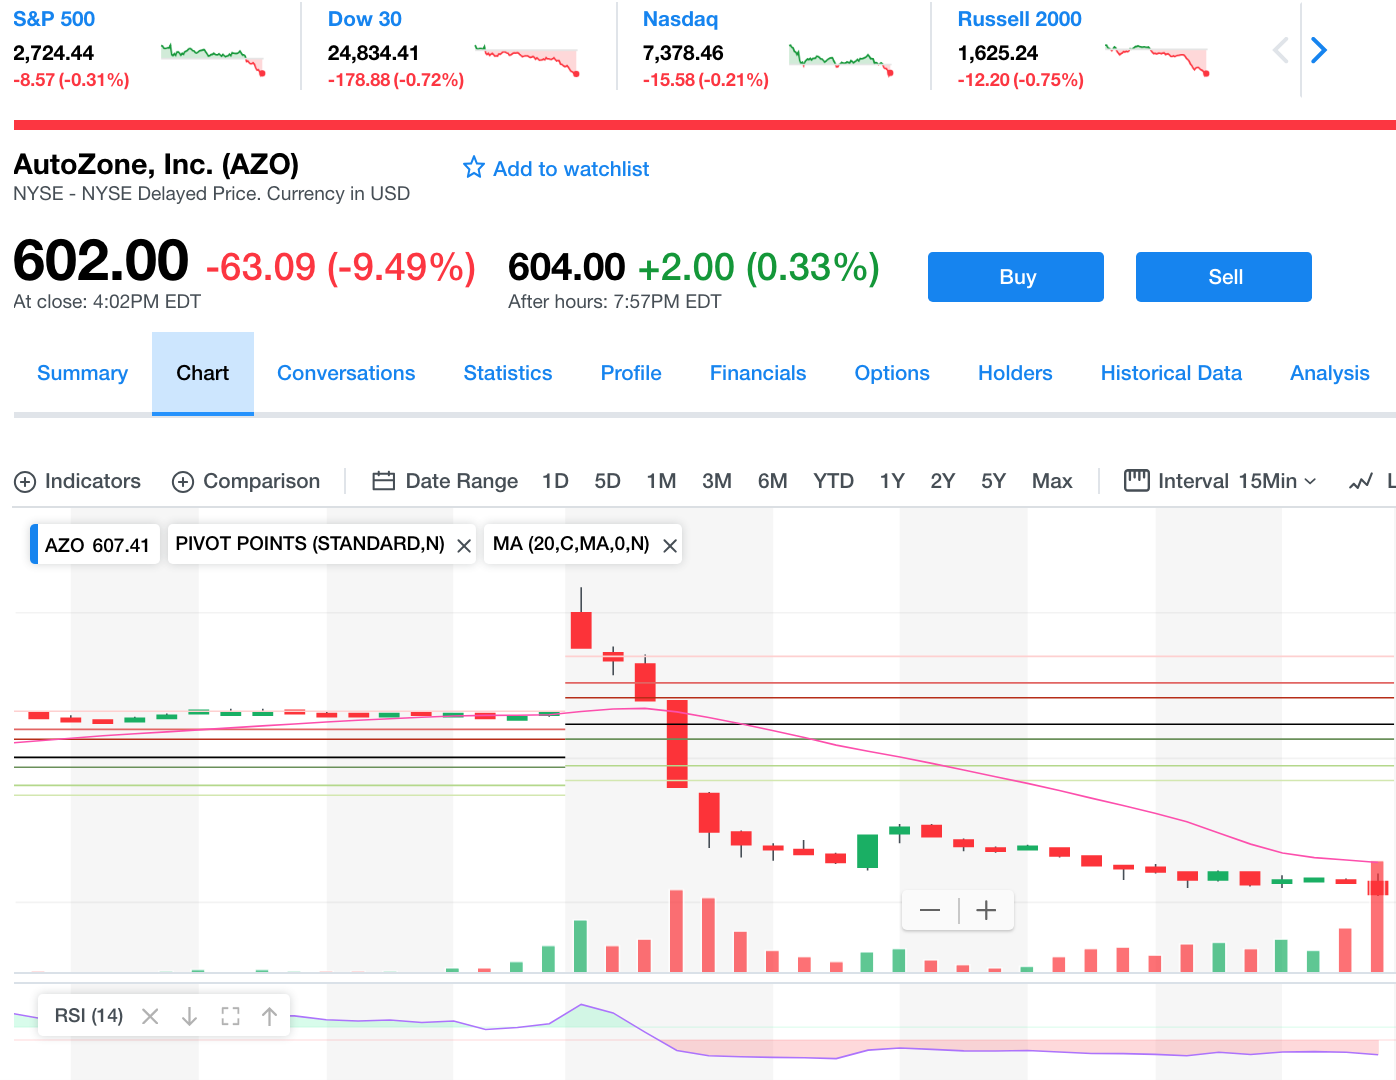
- There are seven basic pivot levels on the chart:
- •Basic Pivot Level (PP) – This is the middle and basic pivot point on the chart.
- •Resistance 1 (R1) – This is the first pivot level above the basic pivot level.
- •Resistance 2 (R2) – This is the second pivot level above the basic pivot point, and the first above R1.
- •Resistance 3 (R3) – This is the third pivot level above the basic pivot point, and the first above R2
- •Support 1 (S1) – This is the first pivot level below the basic pivot point.
- •Support 2 (S2) – This is the second pivot level below the basic pivot point and the first below S1.
- •Support 3 (S3) – This is the third pivot level below the basic pivot, and the firs below S2.
-
- In this regard, Pivot Points are predictive or leading indicators. There are at least five different versions of Pivot Points. I will focus on Standard Pivot Points. Daily pivot points are calculated based on the high, low, and close of the previous trading session. Pivot points provide a standard support and resistance function on the price chart.
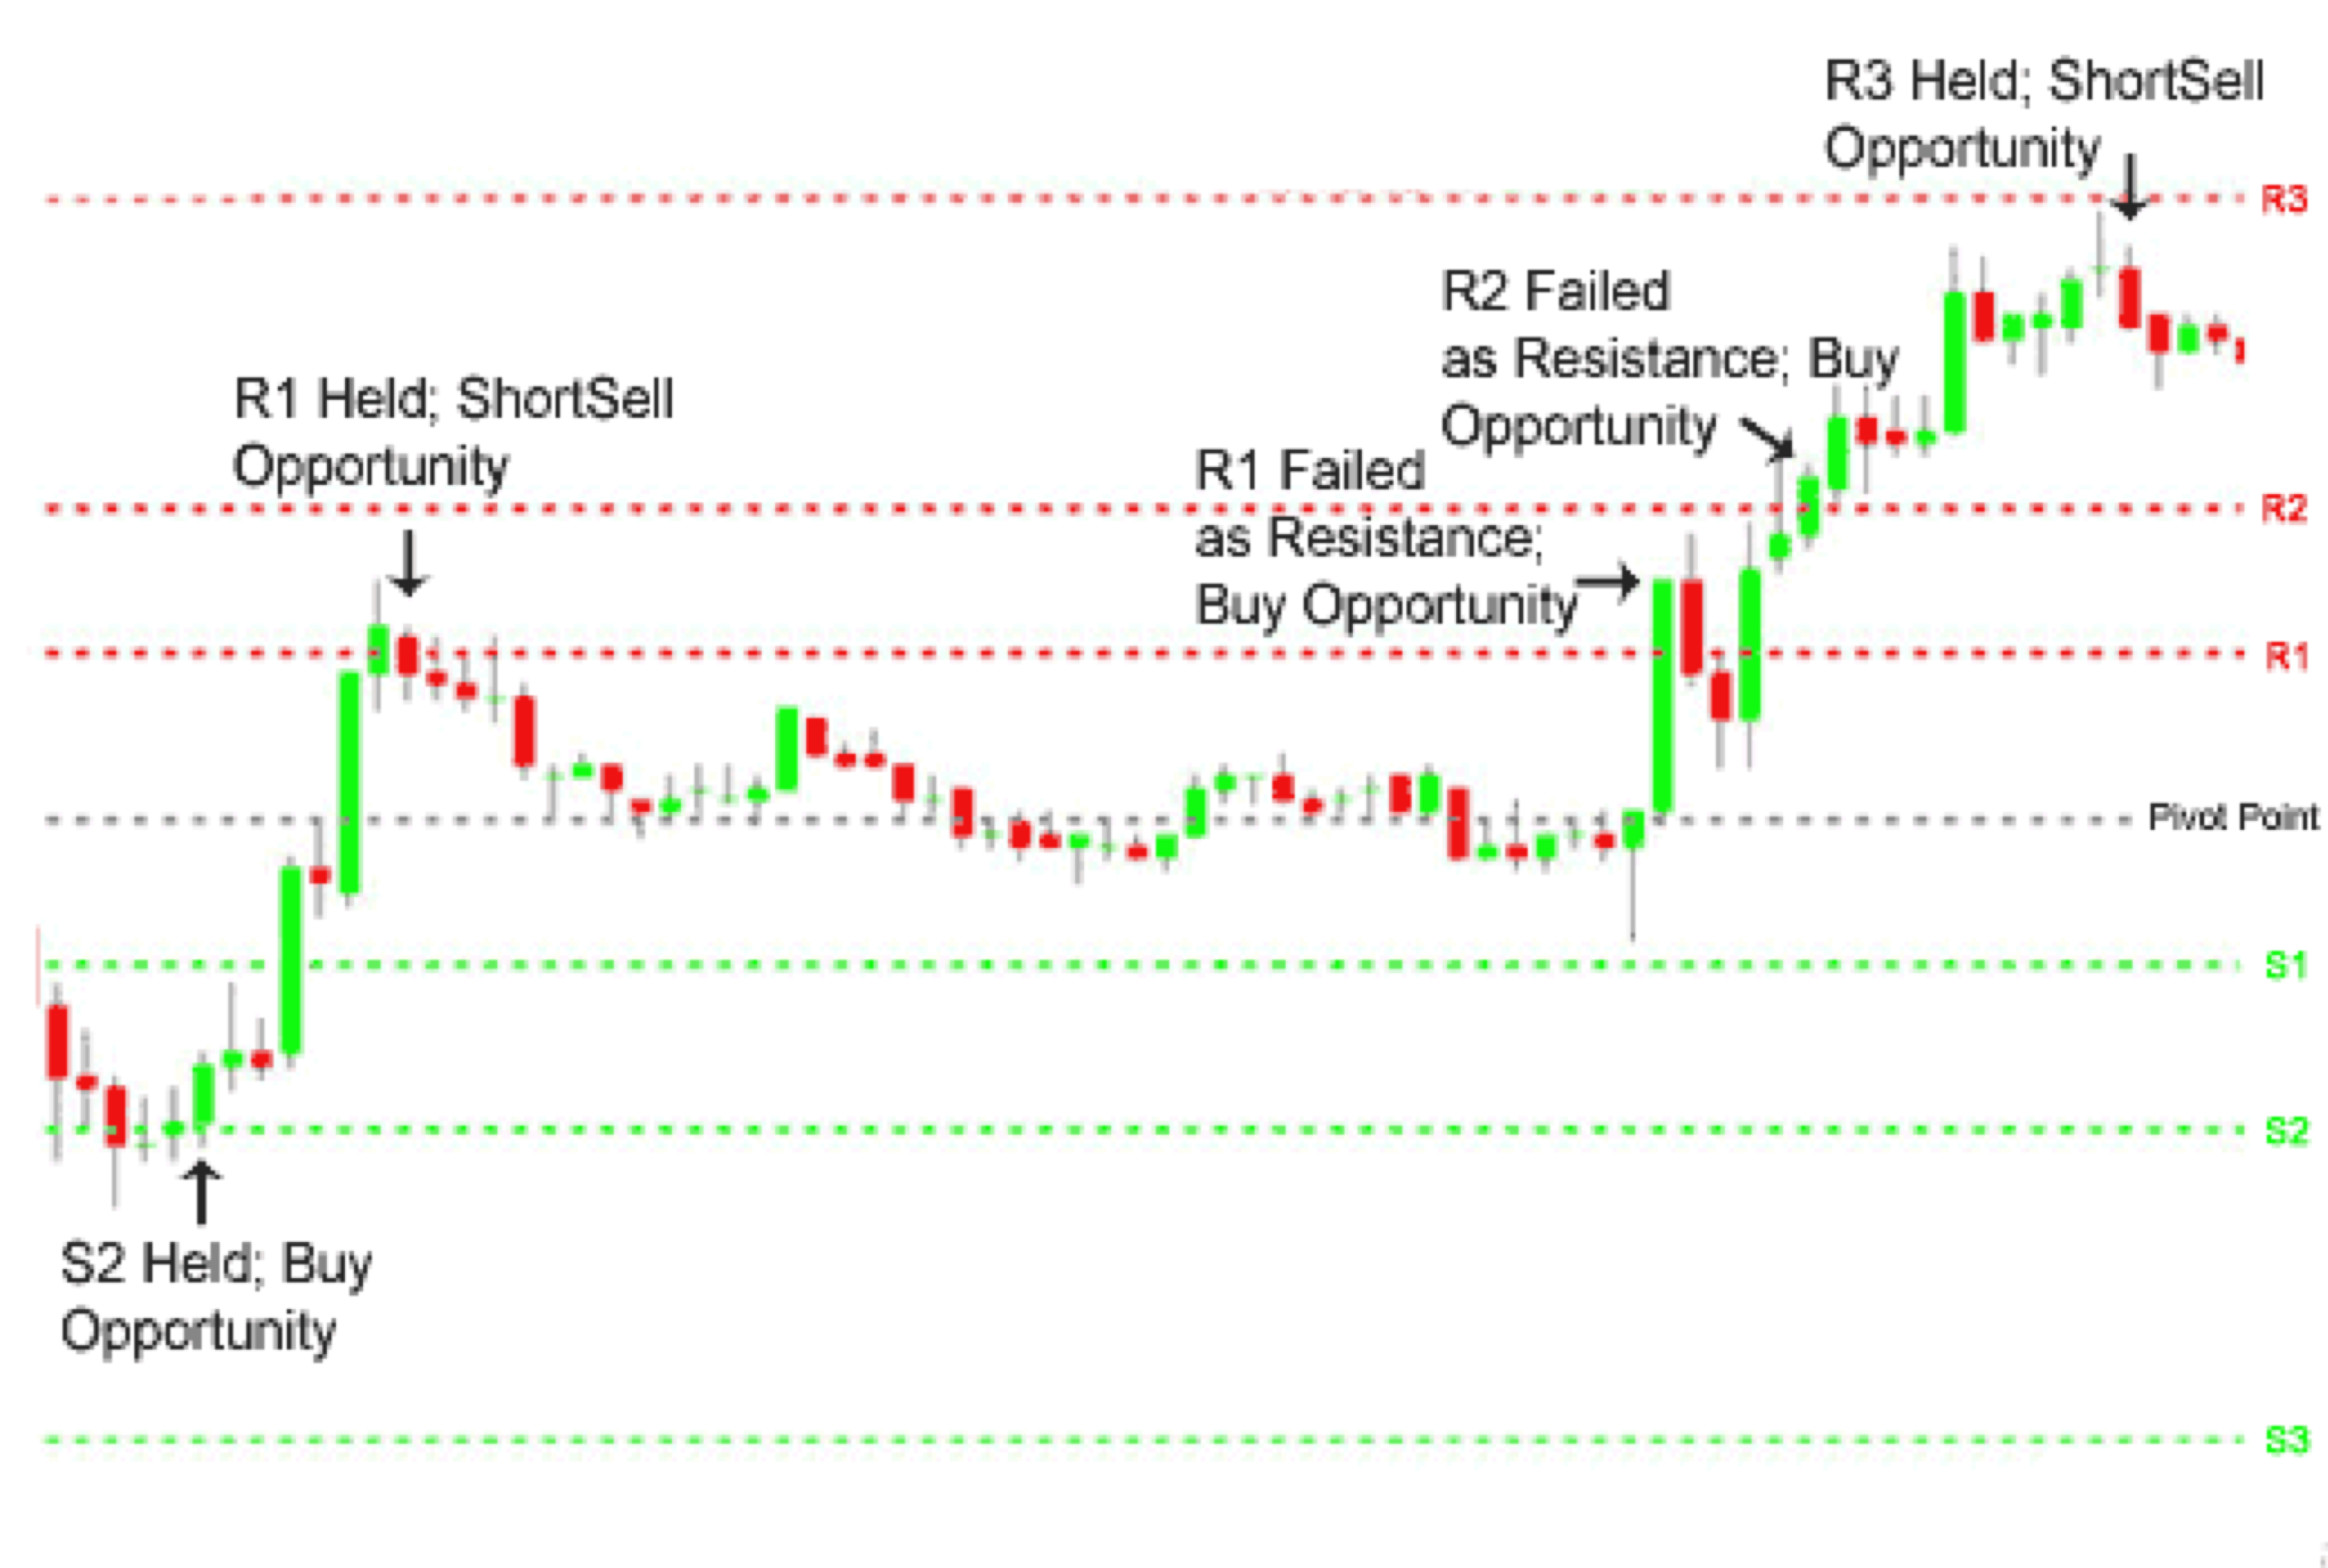
- When price action reaches a pivot level it could be: Supported/Resisted or Extended (breakouts).
- If you see the price action approaching a pivot point on the chart, you should treat the situation as a normal trading level. If the price starts hesitating when reaching this level and suddenly bounces in the opposite direction, you can then trade in the direction of the bounce.
- However, if the price action breaks through a pivot, then we can expect the action to continue in the direction of the breakout. When price clears the level, it is called a pivot point breakout.
- Pivot Points for 1-, 5-, 10- and 15-minute charts use the prior day's high, low and close. In other words, Pivot Points for today's intraday charts would be based solely on yesterday's high, low and close. Once Pivot Points are set, they do not change and remain in play throughout the day.
- Pivot Points for 30- 60- and 120-minute charts use the prior week's high, low, and close. These calculations are based on calendar weeks. Once the week starts, the Pivot Points for 30- 60- and 120-minute charts remain fixed for the entire week. They do not change until the week ends and new Pivots can be calculated.
-
Information
- Description
- ELITE IIVII Option Series: Session III
- Created by
- Deleted user
- Views
- 26
- Tags
- History
-
- Created by ELITE IIVII · May 2, 2018
- Copied by ELITE IIVII · May 15, 2019
- Rating