
Karteikarten
Statistics

Karten in diesem Stapel (76)
- 1Why we need a replicated trial? Why is the unreplicated trial not good to apply in the statistical test?If we do unreplicated trials,
1. How should we decide whether the "difference" in an experiment is statistically "meaningful" or not?
2. How do we know the "precision of the estimate"?
3. How do we know "the higher value will still the higher value" if we wouldn't repeat the experiment? - 2How to deal with known or expected sources of variation? How to deal with unknown sources of variation?For known sources of variation:
* Blocking
For unknown sources of variation:
* Replication
* Randomisation - 3Why we need a replication?We need more than just a single observation, to know:
1. How "precise" the estimated difference between the cultivars
2. Whether the observed difference is large in some "defined way" - 4Why we need a replication?Variation
We need to compare the difference between the two cultivar means with some measure of the natural variability in yield between plots containing the same genotype to know:
* whether two cultivars have a yield difference that is significant
The question to ask:
1. Can such an observed difference between cultivars very likely be the result of the natural variability between the plots (So, it is not statistically significant)
2. Is the observed difference (much) larger than what we could reasonably expect, given the natural variability (So, it is statistically significant) - 5What are important aspects we should concern if we do statistical inference?If we want to do statistical inference, we concern on:
1. The average
2. The variability of a response --> by doing a replication --> to compare the size of cultivar differences within this variability - 6What are the functions of replication?Replication
1. To estimate "the average" of an experiment with "higher accuracy"
The standard error of a mean over n observation is equal to σ/√n
So, "the larger the number of observation" for a mean value, "the smaller the standard error" of that mean (jadi semakin besar nilai rata-rata observasi, maka semakin kecil standar eror).
2. "To allow statistical testing" by estimating the natural variability and comparing treatment differences against the between-plot within-treatment variability - 7What are the functions of replication?3. To "infer knowledge" about the "population characteristics" --> a larger sample size will obviously represent the population better than a small sample size
4. "To obtain separate estimates of the
G x E effect and the random variability"
--> because an increase or decrease in differences between genotypes for some trait value could be either due to:
a. the genotype specific interactions to that particular environment (G x E) or
b. to random variability present in the environment - 8What are the benefits of replication?1. Obtain adequate variability measures, which is needed for:
* Statistical testing
* Measurement of data quality
2. Increase the power
The larger the number of reps, the smaller the effects that can be discovered
3. Increase the robustness of the test
* Averages from large numbers of reps will be close to normal distribution
* Estimated sample variance will be closer to the true variability
4. Allow generalisation from individuals to the population level - 9Experimental unitExamples:
1. Study effects of diets on growth of pigs
* All pigs in a box are fed the same diet
So, experimental unit: BOX
2. Each cell consists of multiple beds, each bed of multiple individual mushrooms
So, experimental unit: ENTIRE CELLS
3. Study some chemically active compounds in tissue samples
Duplo measurements per sample
So, experimental unit: Tissue samples
CLUES:
Experimental unit harus fixed, tidak berubah-ubah. Di contoh no 1, pigs bukan experimental unit karne dia bisa berubah (satu makan lebih banyak dari yg lain) - 10The rule of thumb of the residual degrees of freedomThe rule of thumb (aturan praktis):
The residual degrees of freedom should be larger than 12 --> 1. to "have a reasonable estimate" of the variance; 2. to have some "minimum power of analysis"
In the experiment, we test some effects of interest against a residual error in ANOVA. Therefore, the degree of freedom for the residual variance "should not be too small" to make a test valid - 11What is the reason that a statistical test sometimes is not significant?When a test is not significant, it can be due to "the experimental setup did not have enough power" to detect such a difference as statistically significant because there was "a small number of the replicates"
- 12What is the residual variance in ANOVA?In Anova,
The residual variance is a pooled variance estimate, pooled over all treatment combinations
The use of ANOVA automatically implies
--> if we have more treatment combinations in a single experiment, the number of replicates per treatment can be smaller than in the case that each treatment would be done in separate experiments --> in order to have similar statistical power - 13How to set up the minimum number of degree of freedom in association with the number of replicates per treatment?For example:
* If we have 2 treatment levels in a simple experiment without blocking, we need 7 replicates of each in order to have 12 degrees of freedom for residual ANOVA (14-2)
* If we have 12 treatment levels, we just need 2 replicates of each to have the same number of degree of freedom
(24-12)
Conclusion,
If we have only 2 treatments we need 7 replicates, but if we have 12 treatments we need only 2 replicates in order to have the same statistical power to get 12 degrees of freedom - 14What is the function of blocking?Blocking
It can be very helpful to apply the blocking if we know there are strongly systematic differences in the field that could influence our results
Ex.
If there is a different moisture gradient in the field and by doing a random assignment of cultivars to plot, the cultivar A is assigned more often to very wet fields whereas the cultivar B is to very dry fields --> this will lead to an undesirable effect because the power of our statistical test might be decreased strongly - 15What is the function of blocking?1. To take into account "known or expected sources of variation"
2. Prevent confounding of these with your factor of interest
3. Reduce variability by correcting for that part of the variance
Variation in test is divided as variation with we are interested in and with we are not interested in --> usually occur in the field --> to reduce the effect of variation that we are not interested in, therefore we usually use blocking - 16How to design a block? Ket. gambar: A randomised complete block design with 3 cultivars in each of 5 blocks (here, the conditions are most similar to the plots within the blocksIf the moisture soil content is different from west to east, we can divide the experimental units into blocks of multiple plots to make:
1. a fairly comparable moisture level, or to make the same moisture level
2. whole block differences match as much as possible - 17How to design a block?Example:
The plot within the blocks should run North-South so that these plots within a block are on about the same moisture level. Going from block to block, we can go west-east with block 1 may be situated all the way west (high moisture) and the last block all the way east (low moisture) - 18How to design a block effectively?It should not be too large
because the variability between plots within a block might become large
So, it is better to consider incomplete blocks (each block does not contain all the treatments but the treatments should be divided over the blocks in a sensible way)
Example:
1. Balanced incomplete block designs (BIB)
2. Alpha design
3. Row-column designs
The disadvantages of having the incomplete design:
* The comparison between treatments will be partly within blocks, and partly between blocks.
Therefore, the variation between blocks may be very different from the error within blocks. Then, these should be estimated separately by using "mixed model theory and REML (residual maximum likelihood) estimation - 19What are the advantages of the block?1. We can correct for some of the effects due to moisture differences (example), thereby increasing the statistical power of the test
2. We can compare the cultivars within the blocks under more or less similar conditions with respect to moisture
Here, the estimates of treatment effects and of the residual variation are not affected by the large variation between blocks --> because the variation due to block differences is taken out of the analysis of variance
Blocks do not occur just in field trials. The person tasting different food types can be considered as 'blocks'.
Or, we have measurements with replicates divided over different measurement days. Here, days are a blocking factor - 20What are the purposes of randomization?Randomization, purposes:
1. To avoid confounding of treatments with (possibly unknown) differences in the experimental units that we did not consider in the blocking structure
2. To know the difference between the cultivars was due to their genetic makeup or to the environmental factors
3. To allow statistical inference, when the assumption of independence of experimental units is required.
To do the randomization, we can use some statistical packages or use random number generators such as are present in Excel - 21What are the purposes of randomization?1. Randomization avoid creating correlations
2. Allow generalisation to the population level - 22What are the three important aspects in doing statistic in plant breeding?1. Blocking
to account for expected or known systematic differences
2. Randomization, within the blocks,
to account for unknown sources of variation and to allow statistical inference
3. Replication
across or within blocks, to allow estimation of the residual variance and to increase the accuracy of treatment means
Extra consideration:
4. Size of blocks
5. Border rows
It is planted with plants similar to the ones in the trial, but these are not used in the analysis.
Keep in mind, the borders should be much more or much less vigorous than the ones in the trial. Otherwise, the effect of having border rows might be lost. - 23What is the two-sample t-test?Comparing two genotypes: two-sample t-test
Ex. Whether there is a difference of yield between cultivar A and B
We can estimate the difference between the averages of the two genotypes. Under the assumption of normality, this estimator would have a normal distribution with expectation μA - μB and variance.
So, we compare the calculated value for t with critical values from the t-distribution with df = r1+r2-2 df to know whether there is a difference between the genotypes A and B - 24How should we do a statistical analysis if we have more than two genotypes?Comparing more than two genotypes --> Analysis of variance (ANOVA), to answer the question:
Whether there are differences among the population means
In ANOVA, F-test is used to know whether differences between genotype means are large in comparison with differences between the replicates within each genotype
--> It is done by looking at the sums of squares of the deviations from the overall mean of the individual observations, and separating the sums into a part that is due to differences between genotype means and a part that is due to differences of individual observations from their genotype means:
SS total = SS between genotype means + SS within genotypes - 25What are the formulas for MS total, MS between genotype means, and MS within genotypes?The number of degrees of freedom corresponding to the sum of squares: n-1, k-1, and n-k
*MS total = SStotal/ (n-1)
*MS between genotype means = SS between genotype means/ (k-1)
*MSwithin genotypes = SSwithin genotypes/ (n-k) - 26Give an example of a completely randomised design?Example of a completely randomised design
A comparison of 6 genotypes each replicated 3 times, so over 18 plots, in completely randomised design.
The errors of the example above are independent, normally distributed and have an equal variance. - 27Give an example of a completely randomised design?Average over all plots: 18.06
The variance over all plots: 10.56
dari 179.51/17
The total number of experimental units
n = 18
k = 6
df between genotype variation: 6 - 1 = 5
for the residual: 18 - 6 = 12
for the total: 18 - 1 = 17
The calculated F value: (MS genotype/MS residual)
32.086/ 1.591 = 20.17, which is highly significant (p < 0.001)
The residual variance as estimated by the Mean Squares residual s2 is 1.591, so s = 1.261
The mean square residual = standard deviation = 1.591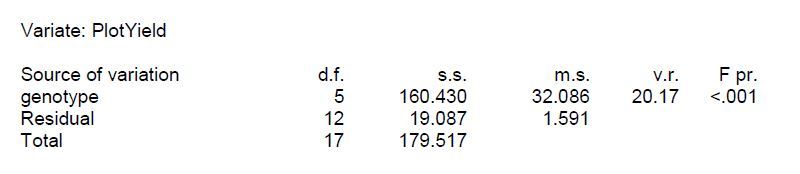
- 28Langkah selanjutnya, to compare the genotype means with each other to find out which ones are differentThe cultivar mean
A: 22.34, dari 22.89 + 22.93 + 21.20 dibagi 3
B: 21.06, C: 18.92, D: 16.81, E: 15.02,
F: 14.23
The standard error of the mean (SEM):
standard deviation/ square root of the number of observation
So, SEM: square root dari 1.591/3 = 0.728
The standard error of the mean --> a measure of the variability of the mean value --> it can be used to construct confidence intervals for each mean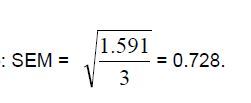
- 29Give an example of a completely randomised design?Since the number of replicates is the same for each genotype, the standard error of the mean = 0.728 is identical for all genotypes
The t0.975; df (dari table) = 2.18
So, the 95% confidence intervals for the means would be:
A: 22.34 ± 2.18*0.728 = [20.75, 23.93], dst
The confidence intervals allow us to compare each genotype means to a pre-defined value
Ex. we want to know whether the expected value for genotype A could be 25, we can check if 25 is inside the confidence interval for genotype means A. This is not the case, so we can conclude that the expected mean for genotype A is significantly different from 25. - 30What is the purpose of the standard error of the difference of means?The standard error of the difference of means, purpose:
* To compare the means with each other
1.261 itu dari the square root of 1.591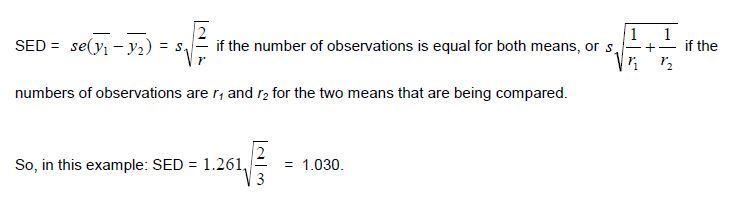
- 31What is the definition of the least significant difference?The least significant difference:
the absolute difference between 2 means that would be significantly different
--> if the absolute value of the difference between two treatment means is larger or equal to the LSD, those treatments are considered significantly different.
Here, df: 12 and the value for tdf (dari table) = 2.18.
The LSD: 2.18*1.030 = 2.24
So, if the difference between 2 genotype means is 2.24 or more, that difference is significant.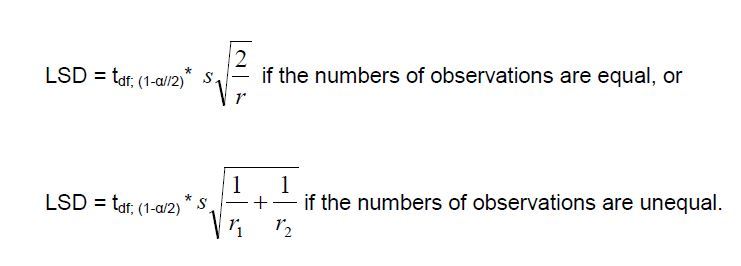
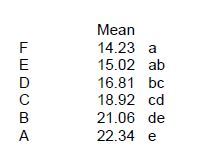
- 32How to define the least significant difference? What is the meaning of the letter in the LSD?Genotypes that share a letter are not significantly different. Ex. E is not significantly different from F, while E is also not different from D. However, E is significantly different from C, B, A because E do not share the same letter
- 33What are the differences between LSD procedure from doing a two sample t-test for two genotypes?In the ANOVA:
1. The residual variance is used as an estimate of σ2, whereas this is a pooled estimator of the variance over all the treatments that were present in the ANOVA
2. The number of degrees of freedom is the df from the residual in the ANOVA table
In the two sample t-test:
1. s2 would be the pooled estimator over only the two treatments of interest
2. The number of degrees of freedom would be r1 + r2 – 2, so just compare the replication number in the two samples
With notes:
* The error variance is equal for all treatments to have:
1. A better estimate of the variance
2. A higher power of the statistical tests - 34What are the general rules of the observations:1. The power of the test increases with the number of df used to estimate the residual variances
2. The variance is estimated more precisely (with less uncertainty) if the number of df is higher
3. Therefore, if the error variance is equal across treatments, it is usually more effective to combine the data in a single analysis - 35What are the benefit values of LSD?1. It is worth to compare the differences between the treatments
2. It is a good indication, whether the experiment was successful in detecting differences of a certain size.
--> By comparing the value of the LSD with the size of the effect that you want to detect as significantly different.
3. It can be used to form a confidence interval for a difference between the expectations of two treatments.
--> If the difference between the means is larger than the LSD, the value 0 is outside the confidence interval, so there is a significant difference.
4. It gives an idea about the power of the test. It tells you the minimum size of difference that can be detected as statistically significant.
--> By given these estimates, you can also estimate how the LSD would change if the number of replicates higher or smaller.
--> Vice versa, you can also calculate the detection power for different numbers of replicates. - 36Pseudo-replication (maksudnya kita ngerasa uda bikin replikasi pada experiment, padahal sebenernya itu replikasi yg salah karena replikasi yg kita pake adlh masih experimental unit yg sama)In the experiment, it might take replicate measurements from the same experimental unit with the aim to increase:
1. the number of observations
2. the number of experimental units itself
The relevant standard deviation is --> the random variation among experimental units, and NOT "the variation among individual observations within experimental units"
Furthermore,
The number of df for residual variance should still be SMALLER than the number of experimental units (kalau yg terjadi sebaliknya, maka the result is incorrect) --> as a consequent, the significant difference derived from the statistical analysis might be not different in the reality
In this case, it can be caused by no randomization of the treatments at the level of the individual observations, but rather by only the level of the experimental units - 37Pseudo-replication * Mengukur cewe dan cowo beberapa kali (tapi samplenya cuma satu), so melakukan pengukuran yg sama berkali-kali pada objek yg sama * Replikasi itu: mengukur cewe dan cowo tapi samplenya ada banyak jadi pengukuran dilakukan pada objek yg berbeda-bedaA field trial was done to compare 6 genotypes A to F, whereas there are 3 replicates for each cultivar. So, 6 genotypes were randomised over 18 plots.
From each plot, 3 rows were harvested separately and yield was determined. Furthermore, the harvest of each row was weighed twice (2x)
So, in total:
3 x 18 x 2 = 108 observations from 18 experimental units
3 rows dan 2 weight disini jadi sub-sampling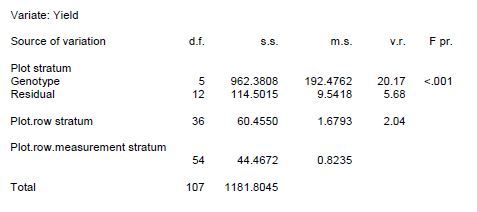
- 38This is the right ANOVA table of 108 observationsAs you can see,
the F-value 20.17 is the same in both analyses, and the df for the genotype and the residual, 5 and 12, are also the same.
The ss and the ms are the same, whereas in the new analyses it should be divided by 6 first to get the same result:
*6 is the number of observations underlying each mean value for the plot: 3 rows x 2 measurements (weight) per row
So, ss: 962.3808/6 = 160.430
ms: 192.4762/6 = 32.086
Also the SEM (standard error of the mean), SED (standard error of differences of means), and LSD are equal in the analyses of the 108 observations using the experimental design - 39This is the wrong ANOVA table of 108 108 observationsIt can happen if we do not take into account the experimental design properly, where we had sub-sampling within each plot by taking 3 ROWS harvested separately and even 2 weight measurements for each row --> kayanya row disini jadi block deh, karena hampir sama dg istilah replicate di table ANOVA yg pertama
In the table, the residual df is 102 (108 - 6), but this is incorrect since there were only 18 experimental units, the plots.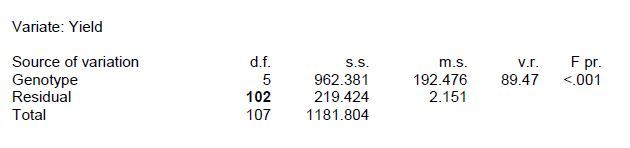
- 40This is the wrong ANOVA table of 108 108 observationsThe ss for the residual, 219.424 --> is the sum of the between-plot residual ss (114.5015), the between-row within-plot ss (60.4550) and the between-measurements ss (44.4672)
The relevant variability, harusnya: the between-plot variability, which is expected to be:
* Larger than the between-row within-plot variability
* Much larger than the between-measurements-within-row-variability
As a conclusion, the new analysis table is wrong on 2 accounts:
1. the number of df for the residual is much too large
2. the mean squares for the residual is much too small
As a consequence, the significance is strongly overestimated - 41So, what are the important messages should be kept in mind from the wrong example above?The analysis should be done in:
1. the proper experimental design
2. the proper numbers of experimental units
3. the proper number of degrees of freedom
So, what are the functions of sub-sampling? It helps to:
1. get more precise estimates of each plot average
2. It will collect the information with respect to the variability within plots between rows and with respect to variability of replicate measurements - 42What are the important parts of the experimental design?1. Replication
2. Blocking
3. Randomization
a well-designed experiment will be easier to analyse and have a higher statistical power - 43A completely randomised design An example of a completely randomised design with 6 cultivars in 3 replicates Six genotypes in three replicates, no blocking Each of the plots has the same probability of receiving any of these 6 genotypes Here we are not doing any correction for field differences1. Completely randomised design
* no blocking factor
* the experimental units are assigned at random to the treatments
* the experimental units should be very homogeneous (this will be difficult to maintain if we have large number of experimental units, as a solution: block design is better to apply)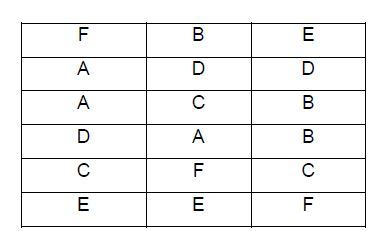
- 44Blocking in the case of a gradient in the field. A randomised complete block design with 3 cultivars in each of 5 blocks Randomised complete block design Each block has all the genotypes Within the block: genotypes randomised over the plots2. Randomised complete block design
* Using a blocking factor to consider about variability between groups of experimental units
* all treatments occur exactly once in each blocks (jadi dieksperimen ini, replikasi itu sendiri adalah block)
* It is assumed that:
1. The differences between the treatments are the same for all blocks
2. The random variability between plots within blocks is the same
- 45A split plot design with 3 blocks, 2 main plots per block, and 4 sub plots per main plots. 2 pre-planting crops were randomised over main plots within blocks, 4 cultivar were randomised over sub plots within main plots within blocks. There are 3 replicates of the pre-planting crops, 6 replicates for the cultivars Split plot design 4 How many experimental units for variety? 4 x 6 = 24 How many experimental units for fertiliser? 6 plotsSplit plot design
* The analyses in much the same way as the randomised complete block design, but:
* There are 3 strata for blocks, main plots, and subplots
A common error of this analysis:
* The structure of the experimental design is not taken into account.
Ex. the analyses of the treatment would be done taking into account only blocks and subplots, the pre-planting crop would be tested against the wrong value of experimental error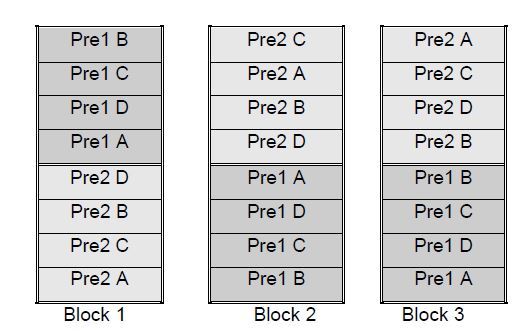
- 46Split plot designIf we want to design experiment with larger experimental units, for example, comparing the influence of different crops as a pre-planting treatment and different cultivars
--> So, it makes sense to have different pre-plantings in larger plots and randomise the cultivar between smaller plots within each the pre-planting plots
As consequence --> we have different experimental errors such as error between the large experimental unit (main plots), error between the smaller subplots - 47Split plot designUsually,
* the variation between main plots will be larger than the variation between sub plots
* The number of replicates for the treatment of sub plots will also be larger
* The df for the estimation of error of sub plots will also be larger than the estimation error of the main plots --> this means that statistical power for testing the treatments will be largest in the sub plots level than in the main plots level - 48—As you can see, there are now 2 lines of residual:
* Residual block.mainplot --> for the comparison of the pre-planting crop
* Residual block.mainplot.subplot
The error variance = 6.39
The F value (dari table v.r: variance ratio) 0.279/6.394 = 0.04
The second residual --> is relevant for testing main effects of cultivars and the interaction of cultivar with pre-planting crop
The error variance of sub plots is 3.95 derived from 22.99/2.38 --> so the conclusion, there are significant differences between cultivar
However, on the table, we have no evidence for main effects of pre-planting of for interaction between cultivar and pre-planting crop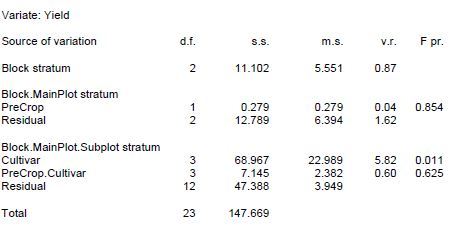
- 49—Compare the result to the previous table
* Now, ss is 1/4 dari ss in the previous table
So,
for the block stratum: 11.102/4 = 2.775
for the PreCrop effect: 0.279/4 = 0.070
for the residual at the main plot level: 12.789/4 = 3.197
The F value: 0.04
The significance level: 0.854
Conclusion:
There is no difference between the analysis using the split-plot design (with blocks, main plots and sub plots) and analyses of variance of the 6 main plot averages over the sub plots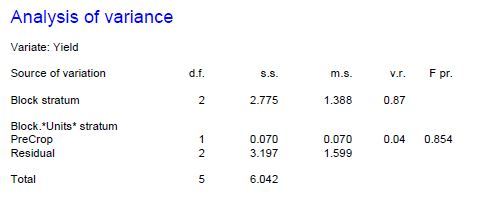
- 50Incomplete block designsIs a solution when we have a large number of treatments --> while using complete block will not be very effective because it will be very large
The disadvantage:
The block effect will be confounded with the differences between the genotype sets present in each block - 51Example: a trial in two blocks where cultivars A to F were tested. Here, the blocks each contain only 4 plots and therefore are incomplete because two cultivars (B and C) are present in both blocks, while A, D, E & F are present in only one blockThe means of block 1: 19.75
The means of block 2: 19.48
The average performance:
A: 17.1
B: 20.3 (dari 21.4 + 19.2 = 40.6/2)
C: 18.0 (dari 18.6 + 17.4 = 36/2)
D: 21.9 --> the highest one
E: 20.3
F: 20.8 --> the second highest
BUT,
B & C are both higher in block 1 than in block 2
Block 1 --> B: 21.4 , C: 18.6
Block 2 --> B: 19.2, C: 17.4
The difference between block
--> B: 2.2, C: 1.2
The average difference between blocks over 2 cultivars
3.4/2 = 1.7
So, 1.7/2 = 0.85
To correct this estimated block difference, therefore in the block 1 we adjust - 0.85 & in the block 2 we adjust +0.85
- 52Alhasil,Before adjustment, D is the highest one
After adjustment, E & F are the highest one, as show the better yield
Therefore, this example shows that the block effects and genotype effects are confounded and the averages of blocks reflect both environmental differences between blocks as well as the differences due to the different genotype sets, and vice versa, when blocks contain different genotype sets
As a solution, do a balanced incomplete block design (a design with equal numbers of all direct comparisons) --> the advantage: the most efficient incomplete block design
the disadvantage: only possible for certain combinations of the block size and the number of treatments.
Only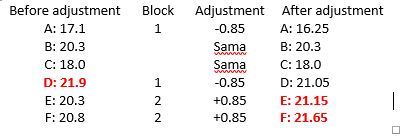
- 53A balanced incomplete block designIf the number of treatments is g, the number of replicates is r, and the block size is k, then there is a balanced incomplete block design possible for the situation where:
λ(g-1) = (k-1)r
Note: only if λ, g, k, and r are all results in integer values (bilangan bulat), a balanced incomplete block design is possible
for example:
the situation with six blocks of four experimental units and six genotypes in four replicates.
λ = 4*(4-1)/(6-1) = 12/5 = 2.4, the number of pairwise comparisons is not an integer. So, in that case, it was not possible to have a balanced incomplete block design.
* Balanced incomplete block designs can be analysed with ANOVA - 54Resolvable designsResolvable designs (useful in the management of the trials):
1. Lattice designs
* The number of treatments "g" must be a square of an integer value
* the block size must be √g
* the number of blocks within a replicate is also √g
* the division of the "g" treatments into blocks in one replicate is "each block includes exactly one genotype from each block of the other replicate" --> so if we have 25 treatments and a block size of 5: in one replicate 5 genotypes are present in the same block, they should be divided over 5 different blocks in all other replicates
Disadvantage: Rigid (kaku) because they require an exact square of an integer (bilangan bulat) for the number of treatments and the square root for the block size and number of blocks within each replicate.
2. Alpha designs
* It maintains the properties of a lattice design (in having equal number of direct comparisons of all treatment pairs) but no need for an exact square of an integer for the number of treatments
* The const - 55Number of replicates needed It is difficult to give the general answer because it depends on many things, some of which will be unknown.1. It depends on the experimental design: A one-sample t-test, a two sample t-test, ANOVA, regression
2. It depends on whether the test is one sided or two-sided
3. It depends on the variation present in the experiment --> this will be unknown prior to doing the experiment, but we could assume an estimate based on earlier experiments.
4. It depends on the level of confidence interval, the required power, and the minimum difference that we want to detect as significantly different
* Genstat will allow power calculations or determination of the number of replicates - 56The comparison: Analysis without blockingA field trial with 5 cultivars (A to E) in 4 replicates.
The experimental design is a completely randomised design
Based on ANOVA calculation, the residual variance as estimated by the mean square s2 = 5.594, and s = 2.365
In the Fisher's protected LSD, if two cultivars share a letter, their difference is smaller than the LSD value - 57The comparison: Analysis with blocking* In the experiment with a block, the ANOVA table has "block stratum" and "block.*units*.stratum", where the part of the variance that is due to blocking differences is given, separated from the rest of the analysis.
The residual value in without block: 5.594
The residual value in with block: 4.732
Therefore, taking the blocks into account is helpful because:
* It increases the statistical power because leads to smaller LSD value
BUT,
The increase of the statistical power is not always true since the loss number of df (due to moves to the block effect coloumn) leads to a higher value of t critical.
If the block effects are very small, the decrease in the residual variance may be so small that does not compensate for the larger value of t critical - 58The conclusion of the comparisonIn the ANOVA, the reason to take block structure into account is that
--> the variation due to block differences is an effect of systematic differences between that blocks.
If there would be no such systematic differences, the variation should have been ascribed (dianggap) to the residual variation as well, and we would end up with completely randomised design (ignoring the block structure). --> kalau effect dari block benar2 nyata dirasakan baru dijadikan bahan pertimbangan untuk include block into the analysis, but if it does not really matter, we just easy to use ANOVAI - 59Control of error rates: Type I and Type II errorsType I error:
In the reality the null hypothesis is true but we conclude that we should reject the null hypothesis
--> this is a false positive test result, we conclude that there is a significant difference while in fact there is none
Type II error:
In the reality, the null hypothesis is not true, but we fail to reject the null hypothesis
--> This is a false negative test result: there is a difference but we don't get a significant test result, so we don't reject the null hypothesis and we say there is no difference in our conclusion - 60The power of testWe do not usually know the power of a test because we do not know the true situation.
We can calculate the power of a test for the different value of the true differences between treatments under an assumption of the distribution under H0 and under H1.
--> in this case, we would to specify the true differences to calculate:
* the power
* the number of observations
* the variance of observations
* the type of distributions
Usually, it can be done by trying different values for the numbers of observations and for the true difference to get an idea of the power of the test under different situations
Genstat --> have procedures to calculate the power of a test, or vice versa, to calculate the number of replicates required to obtain a certain power for detecting a certain difference. - 61Fisher's protected methodIt is used for multiple testing procedures to control the experiment-wise error rate rather than the error rate of an individual test
Here, the term "protected" refers to the fact that:
Pairwise testing among treatment differences is only done if the ANOVA suggests that there are significant treatment differences, so the null hypothesis of the equal mean is rejected at the level a (Type I error). If that is the case, the means are compared with each other. - 62BonferroniThe multiple testing procedures to control on the probability of false positive test result among all test.
The drawback:
This comes at the costs of large probabilities for the type II error (a false negative test result)
In the case of large numbers of tests, we can control the type I errors to increase the probability of true discoveries by using the False Discovery Rate.
The FDR methods are especially used in statistical analyses of high-throughput functional genomic data: transcriptomics, proteomics data, metabolomics data - 63Genotype x Environment Interaction (GE) If the differences between the genotypes are different in the environment (because it compares a number of genotypes in two or more environments)We speak about GE when:
the phenotypic difference between a pair of genotype is larger or smaller in one environment than in another environment.
Notes:
Genotypes have different phenotypic values in two environments is not the same as GE
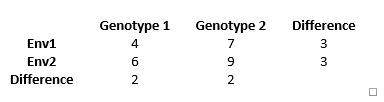
In the figure, both genotypes have a different phenotype in the 2 environments, but there is no information in this case because:
1. The difference between the phenotypic values is the same for the two environments (no increase or decrease of the difference in phenotypic values between the two environments).
2. In each environment, the difference between the two genotypes is the same, and for each genotype, the difference between the two environments is the same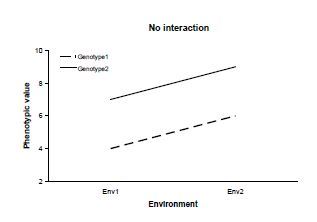
- 64What are the possible situations where there is G x E?1. Convergence
When the difference decreases
If the response of one genotype to the stress factor is stronger than the response of the other genotypes we could have convergence or divergence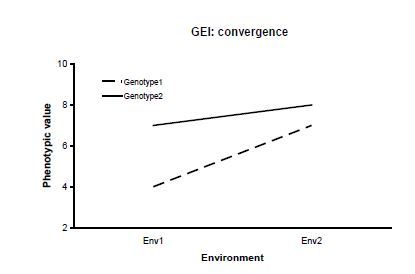
- 65What are the possible situations where there is G x E?2. Divergence
When the difference increases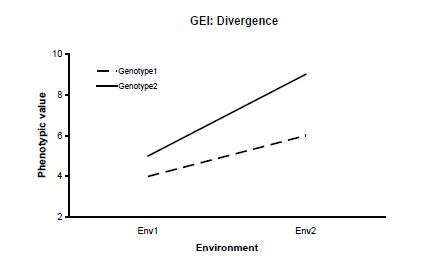
- 66What are the possible situations where there is G x E?3. Cross-over interaction
When the order changes (in the environment 1 it is genotype 2 as the highest, while in the environment 2 it is genotype 1 as the highest)
This type of GE is a large problem in plant breeding. Imagine that we did the selection in environment 2, we select genotype 1 as the best performing. However, in environment 1 genotype 2 is the best.
The phenotypic value of a genotype in an environment is the result of its genetic makeup and the environmental conditions accumulated over developmental time. This is a dynamic process, but neither the environmental situation will be constant in time, nor response of the plant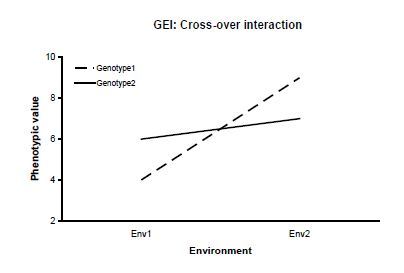
- 67What are the possible situations where there is G x E? Lanjutan cross over interactionCross over interaction:
the best genotype in one environment is not necessarily also the best genotype in another environment.
As a solution:
do multi-environmental trials (MET) in the advanced stages of a breeding program - 68How to do G x E test?It can be done by ANOVA incorporating main effects of "the environments", "the genotypes", "genotype x environment interaction", and testing each term against the random variation present in the multi-genotype and multi-environment experiment.
Notes:
If there are no replicates of each genotype in the environments, it is impossible to separate genotype x environment interaction from random noise.
If there are no replicates, GE and e are confounded and it is impossible to test for significance of GE
So by the lack of replication of each genotype in each environment, we cannot separate which part of the difference values is a systematic effect of the specific combination of genotype and environment, and which part is experimental error.
If there are replication given in the data, so the variance due to GE and e (experimental error) can be estimated, so the statistical tests can be done for main effects of G and environment and GE by comparing the variance to the experimental error. - 69How to do G x E test?The model:
P = μ + G + E + GE + e
μ --> the average - 70Characterizing environmentsWe can do a regression analysis of performance genotypes to environmental variables (temperature, nutrients, rainfall) if the number of environments is large and if there is sufficient variation in the environments.
--> to tell how different genotypes respond to those environmental variables - 71Characterizing environmentsBy doing a regression analysis --> we can characterise a genotype with respect to its individual response to the improvement in the environments
Genotypes that have a good adaptability will have a steep slope (the performance increases strongly as the environment improves) - 72Characterizing environmentsThe slope of the regression line of a particular genotype gives information with respect to its adaptability:
* If the slope is larger than 1, the genotype has a higher than average adaptability
* If it is smaller than 1, it has a lower than average adaptability
The type of regression of the performance of individual genotypes against an environmental index is called Finlay-Wilkonson regression - 73Adaptability, wide adaptation, stabilityGenotypes can be characterised with respect to their response to changing environments
Some genotypes will respond strongly, other will respond much less or have a similar performance in all environments
Adaptable:
If genotype responds strongly to changes in the environment (it will have a regression coefficient > 1 in Finlay-Wilkonson regression)
Adaptability:
The flexibility of a genotype in its response to improved environments
Wide or broad adaptation (more desirable):
If a genotype performing well across a wide range of different environments
Syaratnya:
1. Good average performance overall
2. Little variation across environments
Narrow or specific adaptation:
A genotype has good performance only in a limited range of environments
Stability:
Indicate little variation over environments, or over years - 74What are three ways to obtaining statistically significant?1. Differences are bigger (depends on genotypes)
2. Conditions are more homogeneous (less influence of external factors)
3. Using more replicates (to give a higher power of t statistics) - 75What are the three assumptions of doing statistical analysis test?1. Independence (randomization, proper design)
2. Error variances are equal (to pool them)
3. Normality of the errors - 76Belum rangkum stats powerpointBelum rangkum stats powerpoint
Informationen
- Beschreibung
- Breeding for quality Karteikarten am Statistics, erstellt von Robetauli Simangunsong am 23/07/2017.
- Erstellt von
- Robetauli Simangunsong
- Aufrufe
- 2
- Bewertung