
Mindmap
Ethnic Inequality Education

Inhalt der Mindmap
Ethnic Inequality Education
GCSE
- Chinese & Indians - most likely to achieve five or more
- Black Caribbean boys & Black Africans underachieve
- Mixed ethnicity underachieve the most
University
- ONS 2004
- Most likely to have a degree
- Chinese 31% Indian 25% White Irish 24%
- Least likely to have a degree
- Bangladeshi, Black Caribbean & Pakistani groups
- More Chinese people had no qualifications (20%) than white (15%)
- Most likely to have a degree
- ONS 2004
Department for Education & Skills team - 2007
- Black & Asian undergraduates are less likely to get a first class degree
Lee Harvey (2008)
- Complex social factors affect the attainment of ethnic minorities.
- * Need to undertake paid employment
- * Social Class
- * Family background
Exclusion - 2004!
- Black, Black Caribbean & Mixed White were among the most likely to be permanently excluded (3 times the rate for White pupils!!)
- Chinese & Indian pupils had the lowest exclusion rates
Wright (1987)
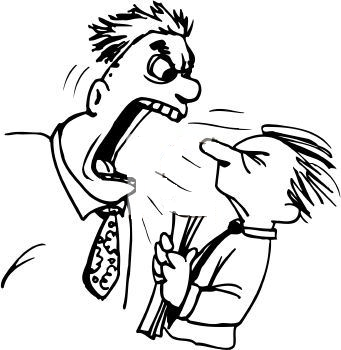
- African-Caribbean boys - more likely to be blamed by teachers for classroom disruption & consequently harshly disciplined compared with White or Asian children.
- Classroom interaction between black youth & white teachers was often characterised by conflict & confrontation
Gillborn & Mirza (2000)
- Black students are treated more harshly than white peers and teachers have lower expectations about the motivation, ability and achievement of black pupils
Bilder und Dateien der Mindmap



Informationen
- Beschreibung
- Sociology (Social Inequality) Mindmap am Ethnic Inequality Education, erstellt von Daniel Johnston am 13/12/2013.
- Erstellt von
- Daniel Johnston
- Aufrufe
- 63
- Tags
- Bewertung