
Mindmap
Statistics

Inhalt der Mindmap
Statistics
Chi Square Distribution: unimodal, right-skewed, non-negative. Used to determine difference between observed and expected values.
- Null: specified proportion distribution fits data well. Alt: ... does not fit data well
- Standardized Residuals: # of sds observed count is from expected count
- d=(observed-expected)/ root expected
- > 2: obs. and hyp. values are significantly different. 1<x<2: somewhat unusual, not sufficient evidence proportions are significantly different. <1: obs. & hyp. values are quite close
- Tests for independence: are 2 categorical variables independent?
- Null: are independent. Alt: not independent
- Expected count >= 10
- d=(observed-expected)/ root expected
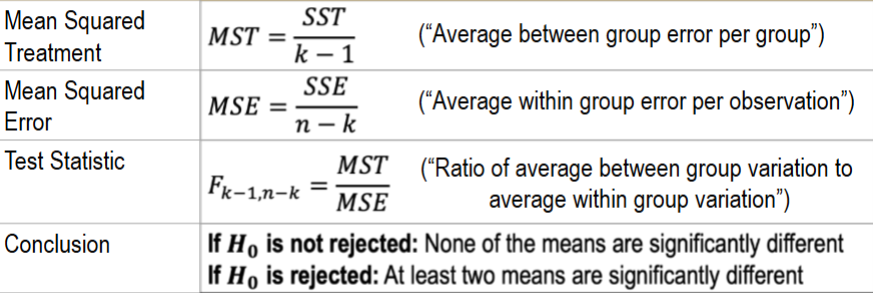
F-distribution: unimodal, right-skewed, non-negative, 2 parameters for df (numerator and denominator). Compares ratio of 2 sources of variability
- Large F-stat = evidence against null
- ANOVA (one-factor analysis of variance): compares means of 3+ populations, has 2 sources of variability
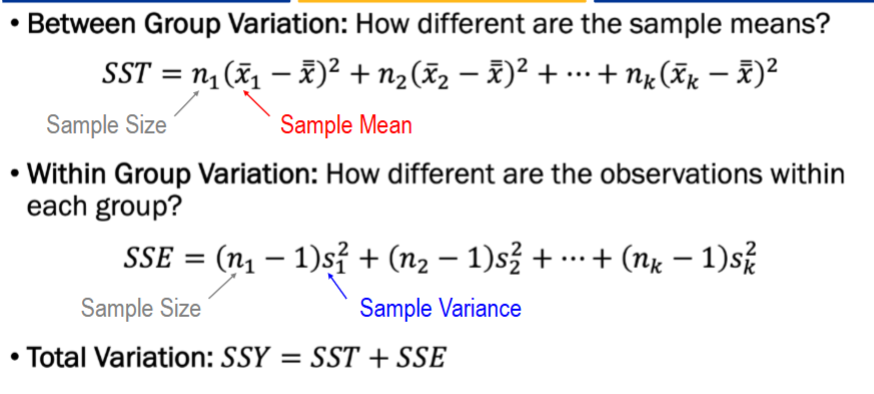
- Between group variation: variability between sample means of groups. Within group variation: variability within samples
- Between group variation: Small: means are close (20,30,40). Large: means far apart (20,40,60)
- Within group variation: Small: obs. close together (range is approx. 10). Large: obs. far apart (range is approx. 40)
- Null: mu1=mu2=... mu k. Alt: at least 2 means are significantly different
- Conditions: sample distributions must be approx. Normal, Spreads of samples must be approx. equal
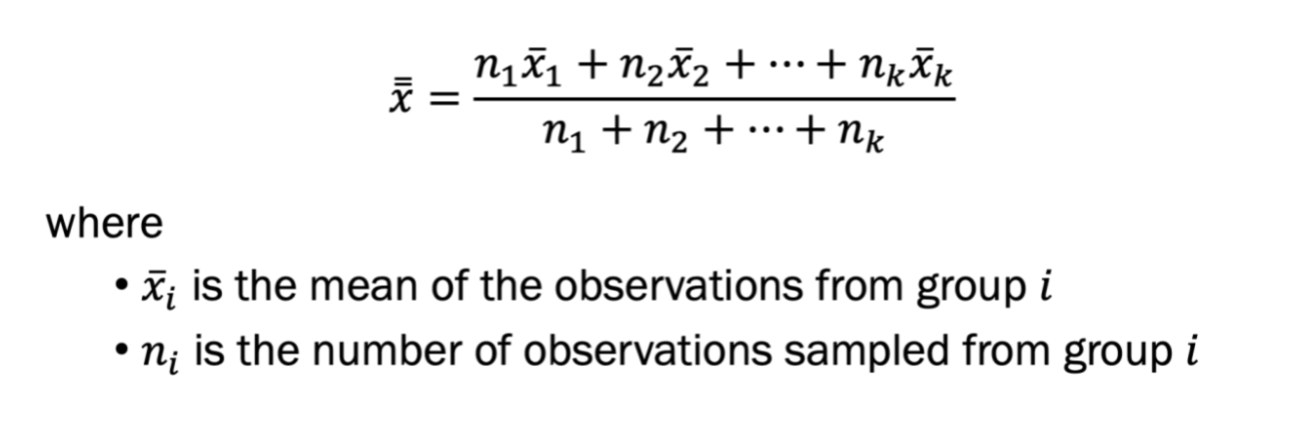
- Grand mean: mean of all obs. (disregarding groups)
- Sources of variation
- Between group variation: variability between sample means of groups. Within group variation: variability within samples
Bilder und Dateien der Mindmap



Informationen
- Beschreibung
- Mindmap am Statistics, erstellt von Aiyana Gary am 07/12/2024.
- Erstellt von
- Aiyana Gary
- Aufrufe
- 1
- Bewertung