
Flowchart
2. Word Population distribution
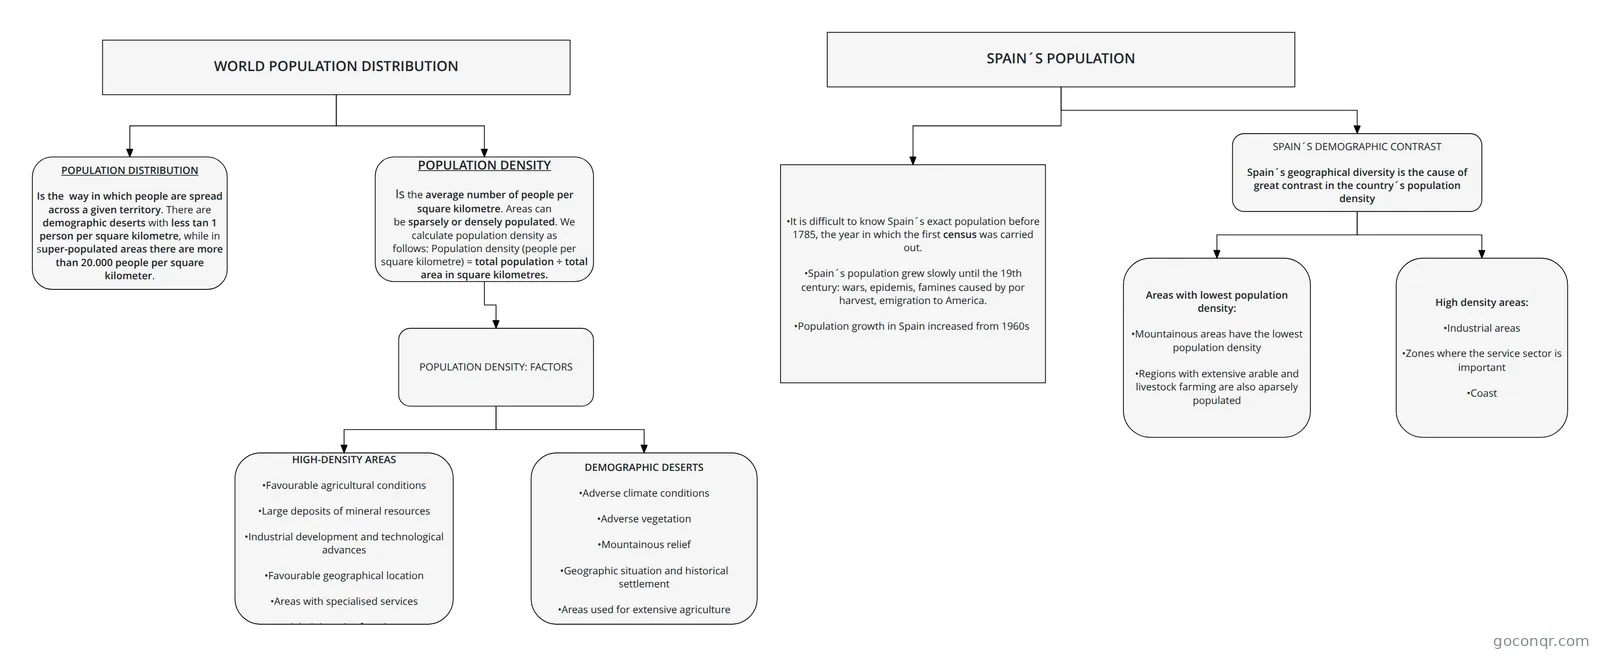
Flowchart: world population distribution
Flowchart content
WORLD POPULATION DISTRIBUTION
POPULATION DISTRIBUTION
Is the way in which people are spread across a given territory. There are demographic deserts with less tan 1 person per square kilometre, while in super-populated areas there are more than 20.000 people per square kilometer.
POPULATION DENSITY
Is the average number of people per square kilometre. Areas can be sparsely or densely populated. We calculate population density as follows: Population density (people per square kilometre) = total population ÷ total area in square kilometres.
POPULATION DENSITY: FACTORS
HIGH-DENSITY AREAS
•Favourable agricultural conditions
•Large deposits of mineral resources
•Industrial development and technological advances
•Favourable geographical location
•Areas with specialised services
•Administrative functions
DEMOGRAPHIC DESERTS
•Adverse climate conditions
•Adverse vegetation
•Mountainous relief
•Geographic situation and historical settlement
•Areas used for extensive agriculture
SPAIN´S POPULATION
SPAIN´S DEMOGRAPHIC CONTRAST
Spain´s geographical diversity is the cause of great contrast in the country´s population density
Areas with lowest population density:
•Mountainous areas have the lowest population density
•Regions with extensive arable and livestock farming are also aparsely populated
High density areas:
•Industrial areas
•Zones where the service sector is important
•Coast
•It is difficult to know Spain´s exact population before 1785, the year in which the first census was carried out.
•Spain´s population grew slowly until the 19th century: wars, epidemis, famines caused by por harvest, emigration to America.
•Population growth in Spain increased from 1960s
Information
- Description
- Flowchart on 2. Word Population distribution, created by Sandra González on 17/03/2020.
- Created by
- Sandra González
- Views
- 3
- Rating
More on Population Distribution and Density