
Flowchart
Untitled
Flowchart content
1.1. The birht rate
The fertility rate
(It is part of birth rate)
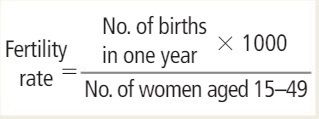
- The fertility rate is the number of births that occur in one year in a particular place in relation to the number of child-bearing age (15-49) in that place.
-It is expressed as an average number of children per woman.
-To calculate the fertility rate:
-The fertility rate is an indicator if the population is stable, growing or falling
- A stable population requires a replacement- level, which is an average of 2.1. children per woman
- The average global fertility rate is currentliy 2,5 children per woman
- In developed countries women have children later and the fertility rates are lower. Ex: Portugal: 1,2 children per woman
- In Less- developed countries women have children earlier and the fertility rates are high. Ex: Niger: 7,6 chidren per woman
1.2. The death rate
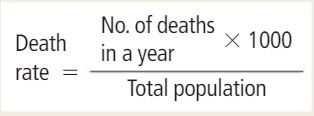
- The death rate is the number of people who die in one year in a place
- To calculate the death rate:
- The result is the number of deaths per thousand people
Death rates have varied over time.
There are contrast between areas.
Falling death rates
- Since the beginning of 20th century the rates have fallen.
- Nowadays the average death rate is 8‰
-Due to: advances in healthcare, improvements in hygiene and nutrition.
Variations between areas
- Europe and Afriva have the highest rates.
- In Africa this is because of poor healthcare, wars and poverty
- In Europe this is because the ageing population has increased
Main causes of death
- Infectious diseases: malaria, tuberculosis and AIDS
- Famines: are often produced by long periods of drought
- In developed countries deaths occur because of cardiovascular diseases, cancer, traffic accidents...
Information
- Description
- Flowchart on Untitled, created by Illán González Rodelgo on 02/04/2020.
- Created by
- Illán González Rodelgo
- Views
- 0
- Rating