
Flowchart
Measures of Central Tendency: Mean, Median and Mode
Flowchart content
2.5 The measures of central tendency
Represent the center point or typical value of a dataset.
Mean(average)
Median
Mode
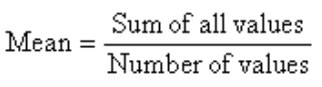
The most common of the measures of central tendency. It is the sum of the values divided by the total
A number that separates ordered data into halves; half the values are the same number or smaller than the median and half the values are the same number or larger than the median.
The value that appears most frequently in a set of data

A data set with two modes is called bimodal.
Sampling Distributions and Statistic of a Sampling Distribution
Is a probability distribution of a statistic that is obtained through repeated sampling of a specific population.
Grouped Frequency Tables
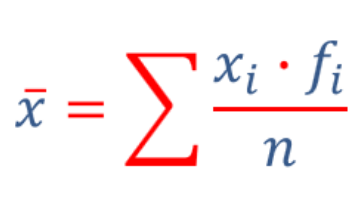
Mean
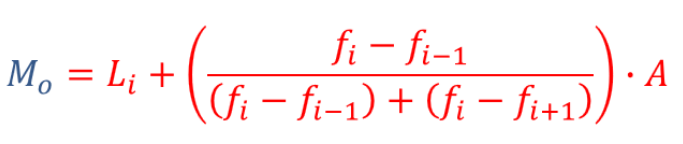
Mode
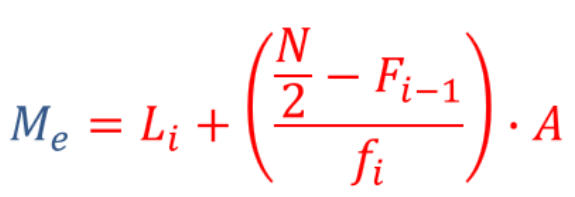
Median
Information
- Description
- Flowchart on Untitled, created by Gabriela Estefania Tapia Mueses on 13/01/2023.
- Created by
- Gabriela Estefania Tapia Mueses
- Views
- 4
- Rating
More on Measures of Central Tendency