
Notes
Climate graph
Content of the notes (1)
Page 1
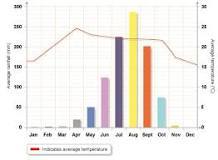
A climate graph is a chart that shows average weather for a certain period of time for a certain location. The precipitation is usually shown using a
bar graph and the temperature is usually shown as a line graph.
Information
- Description
- Note on Climate graph, created by winterwolf111 1 on 01/06/2017.
- Created by
- winterwolf111 1
- Views
- 0
- Rating