
Flowchart
Untitled
Flowchart content
EXHIBITION TOPICS
DECISION TREE
It is based on classification principles that predict the outcome of a decision, giving rise to different branches of a tree. Part of a root, which gradually has different decision nodes. The structure has termination nodes at the end.
•We can solve a problem covering all possible aspects.
•It plays a crucial role in decision-making as it helps us weigh the pros and cons of different options, as well as their long-term impact.
Decision Node
Indicates a situation in which a decision must be made and is represented by a closed square. This is how most decision tree diagrams start.
BRAINSTORMING.
Brainstorming is an unstructured technique for work groups, where solutions to various situations are sought by generating spontaneous, relaxed and horizontal ideas.
Brainstorming will allow you to find new points of view from colleagues you see every day, but may not always recognize as your allies in creativity.
You need a moderator.
It has a well-defined goal.
The session has a set duration.
Pareto Chart
A Pareto chart is a technique that allows you to graphically classify information from most to least relevant, with the aim of recognizing the most important problems that you should focus on and solve them.
It is a simple calculation technique.
Look at the elements and focus your efforts towards a single goal.
Left Y axis. Corresponds to the frequency with which a problem or situation analyzed occurs.
Right Y axis. It refers to the percentage that is accumulated from the total number of occurrences.
Systems approach to decision making
it is also known as systems thinking,or systems thinking.it consists of a method of analysis to obtain a broad reasoning and critical thinking in relation to the phenomena,problems and situations that occur within a systems.
Need Recognition - Information Search - Alternative Evaluation - Purchase Decision - Post-Purchase Behavior
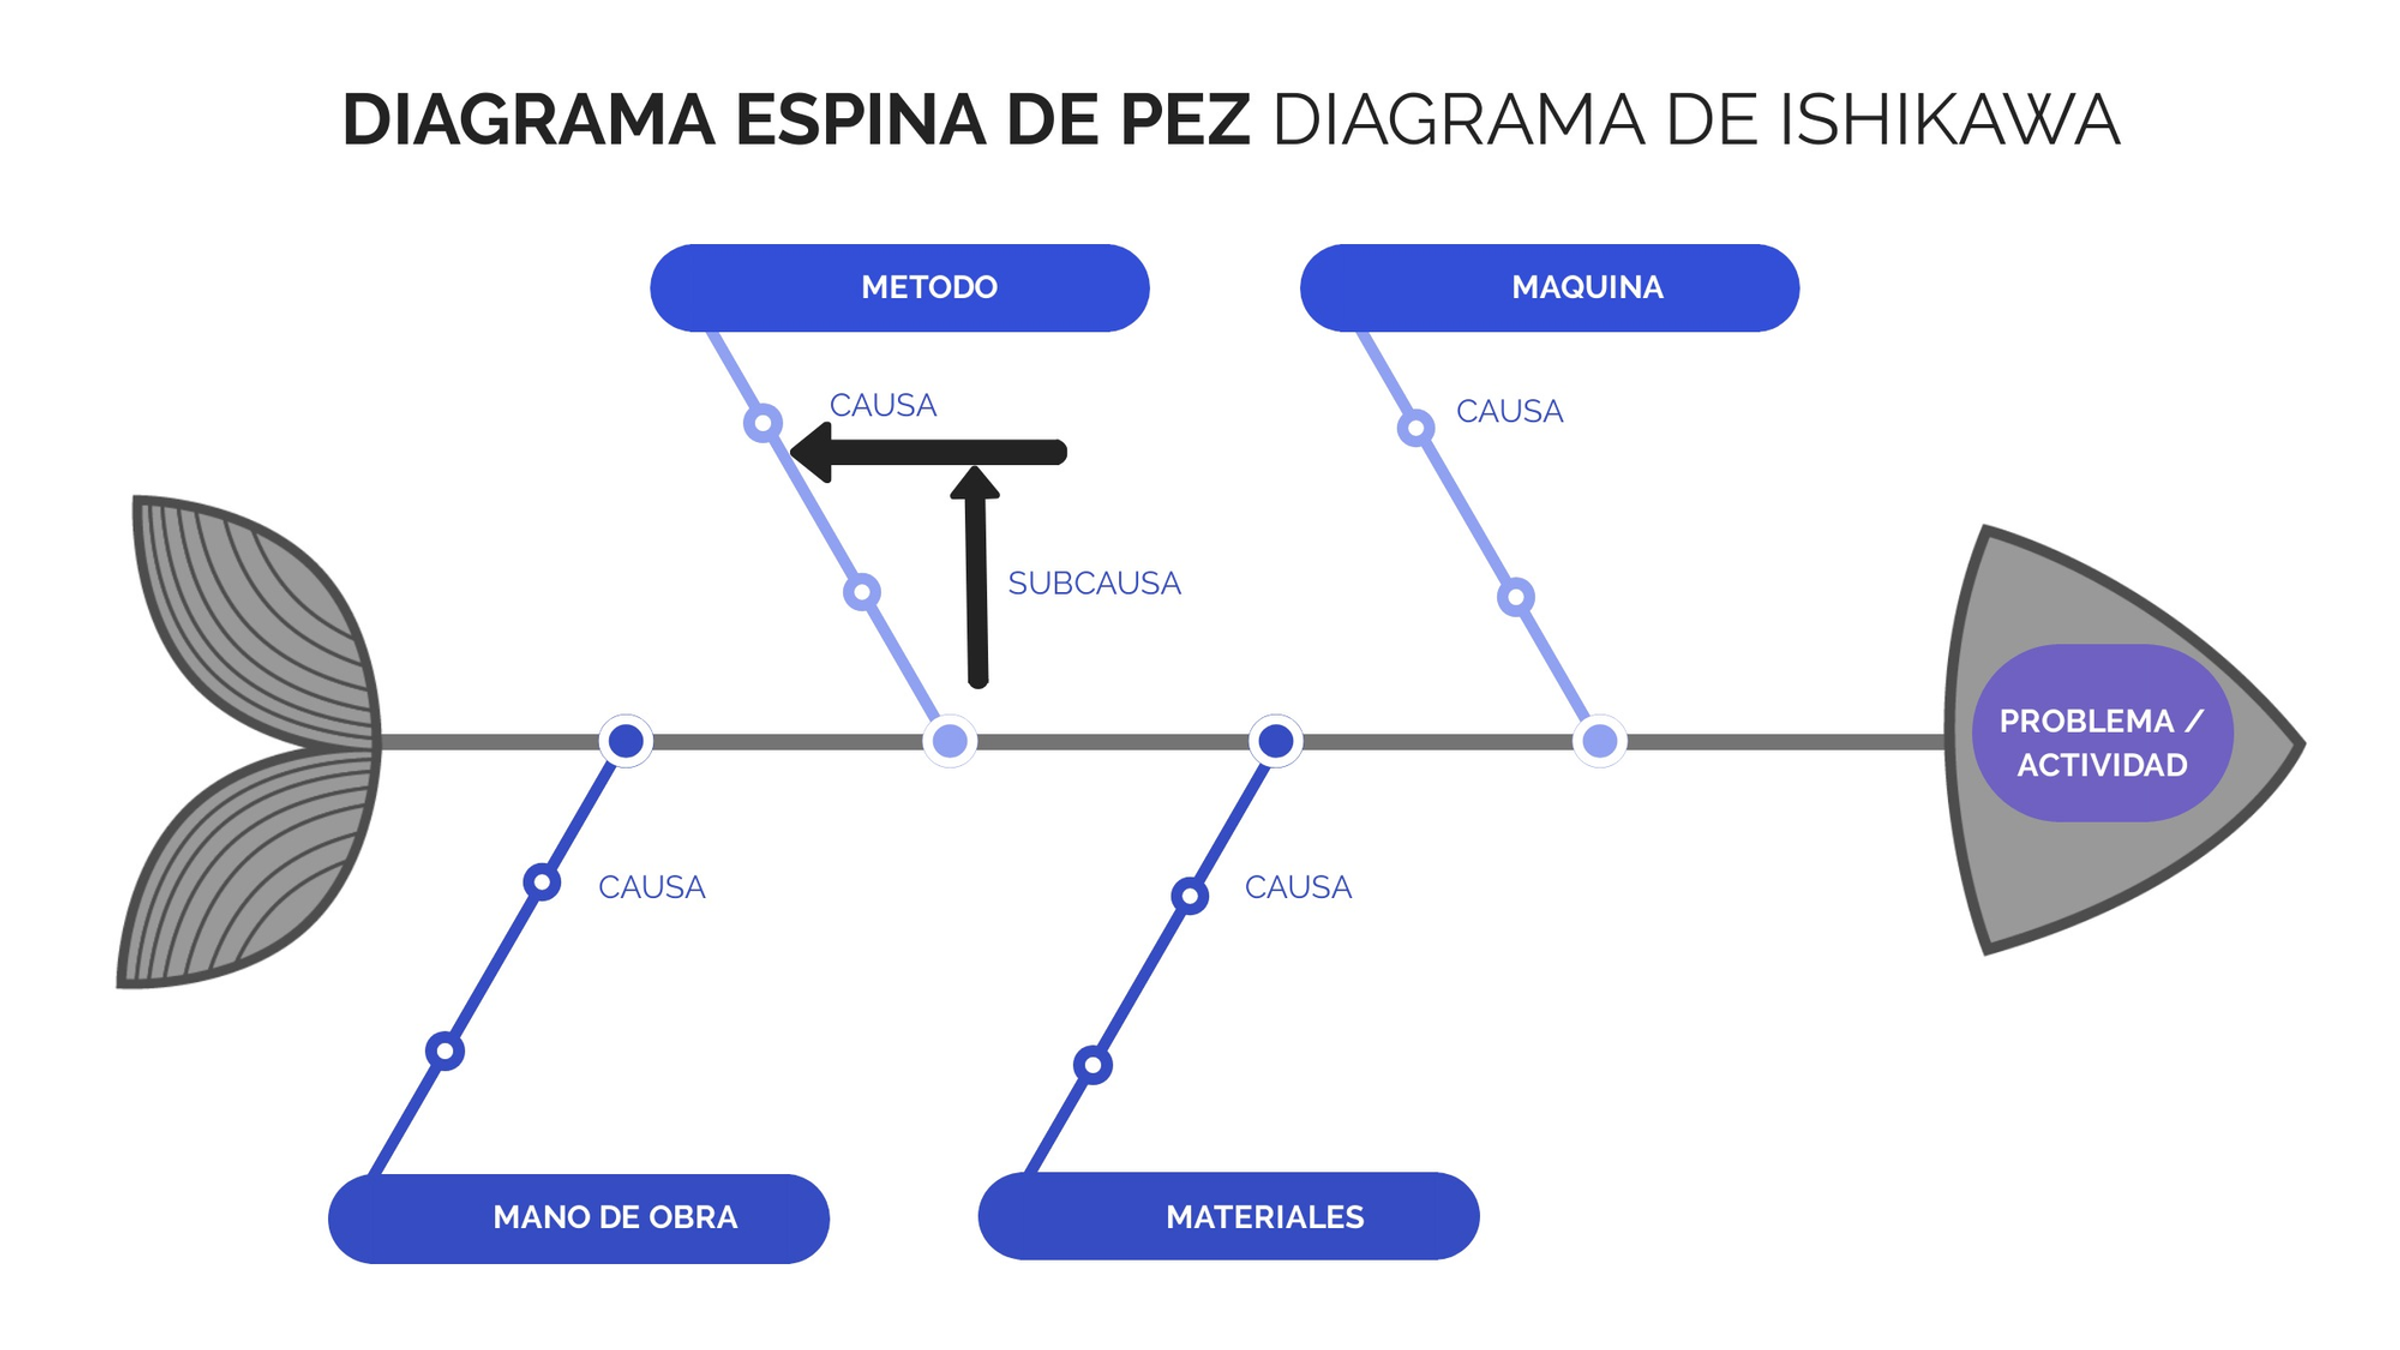
Ishikawa's diagram
are causal diagrams created by Kaoru Ishikawa that show the potential causes of a specific event.[1]
Common uses of the Ishikawa diagram are product design and quality defect prevention to identify potential factors causing an overall effect. Each cause or reason for imperfection is a source of variation. Causes are usually grouped into major categories to identify and classify these sources of variation.
Information
- Description
- Flowchart on Untitled, created by ZAETH CORTES CAZARES on 13/11/2022.
- Created by
- ZAETH CORTES CAZARES
- Views
- 0
- Rating